This highlight showcases the preliminary results from the application of the previously outlined machine learning-based methodology for defining industrial clusters in Québec. The novel approach introduced by Lucien Chaffa and Thierry Warin uses geospatial data on industries from the Registre des Entreprises du Québec (REQ) to quantitively define and identify clusters.
The authors first derive industry growth rates to group industries based on their co-movement over time. Growth rate is defined as the rate at which firms enter (and exit) an industry between 1990 and 2022. From a total of 328 industries classified using 3-digit CAE codes, 190 industries are selected for their variability in size. In this context, industry size refers to the number of firms within it, with a cutoff set at 50 firms.
The strength of inter-industry correlations is assessed using the correlation matrix shown below. Similarities in growth trajectories reveal the shared effects of economic forces, which could be explained by common supply chains, complementary market demands or usage of similar technology.
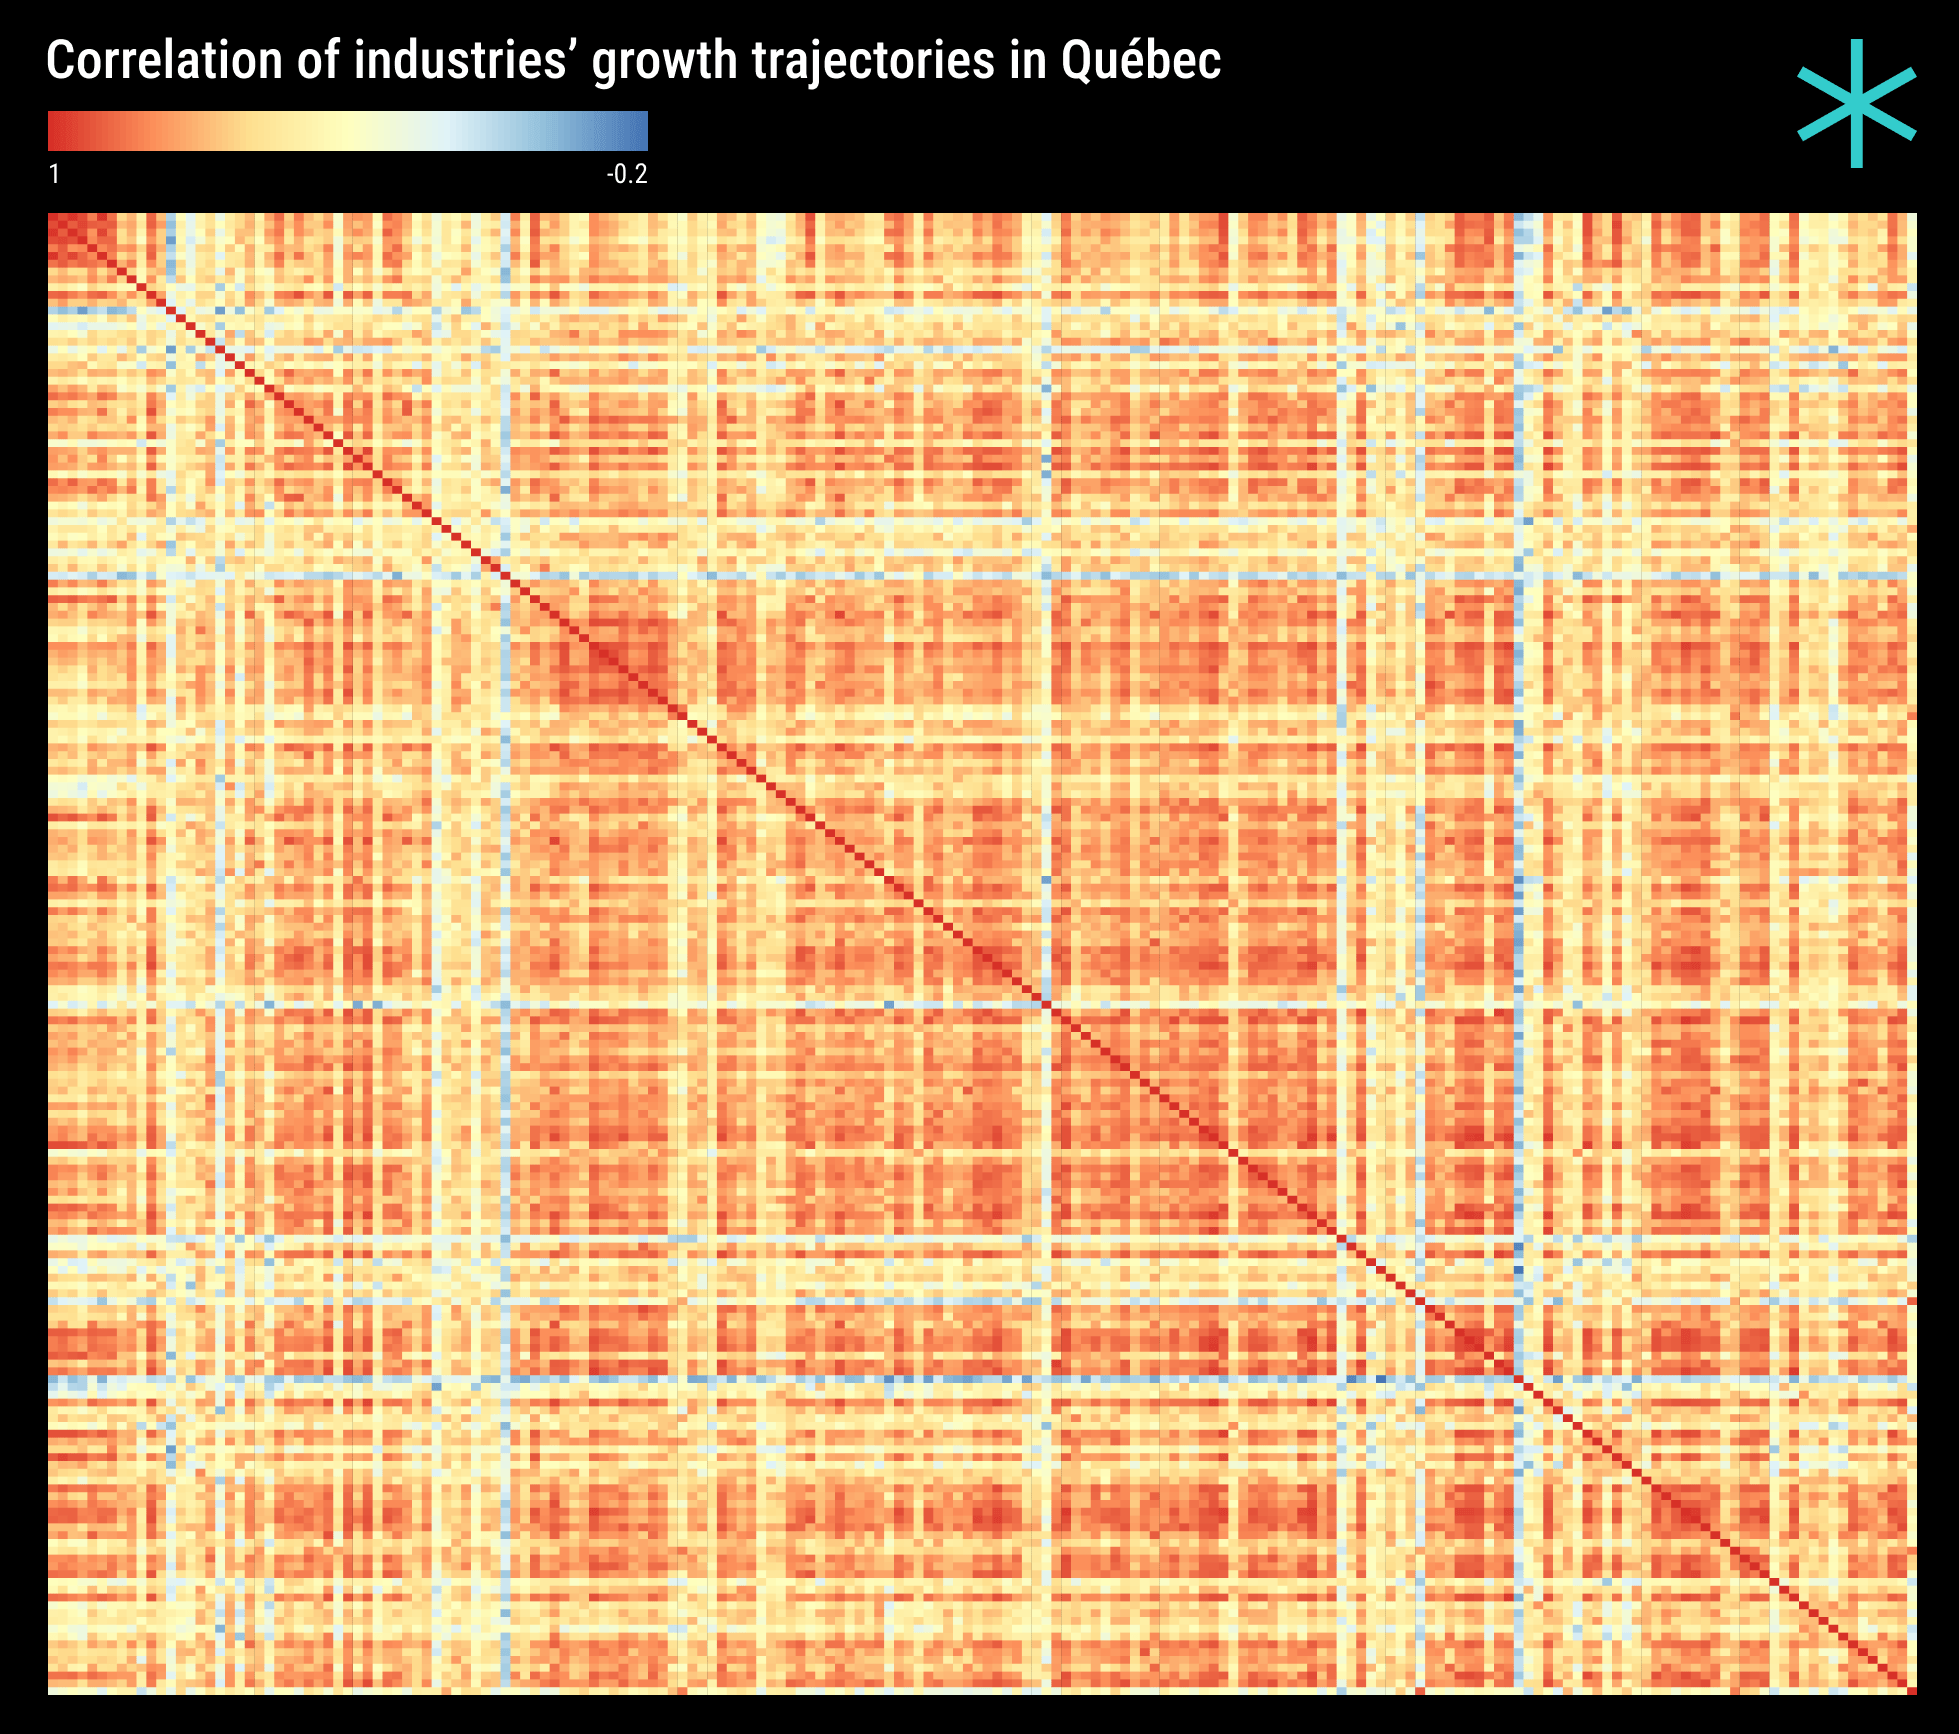
Unsupervised machine learning algorithms are applied to the natural groupings of industries derived from the correlation matrix to group industries with the most similar growth patterns. The perimeter of each group is defined by the strength of inter-industry linkages, as captured by the correlation of growth rates among the industries within each group.
To illustrate this, the following example filters out industries to include only those with a correlation higher than 0.95 with at least one other industry. This results in 15 industries, with the network diagram below depicting the pattern of linkages between industries within this group. While these industries are likely to experience similar impacts from economic shocks and policy regulations, they may not belong to the same cluster in terms of their activities.
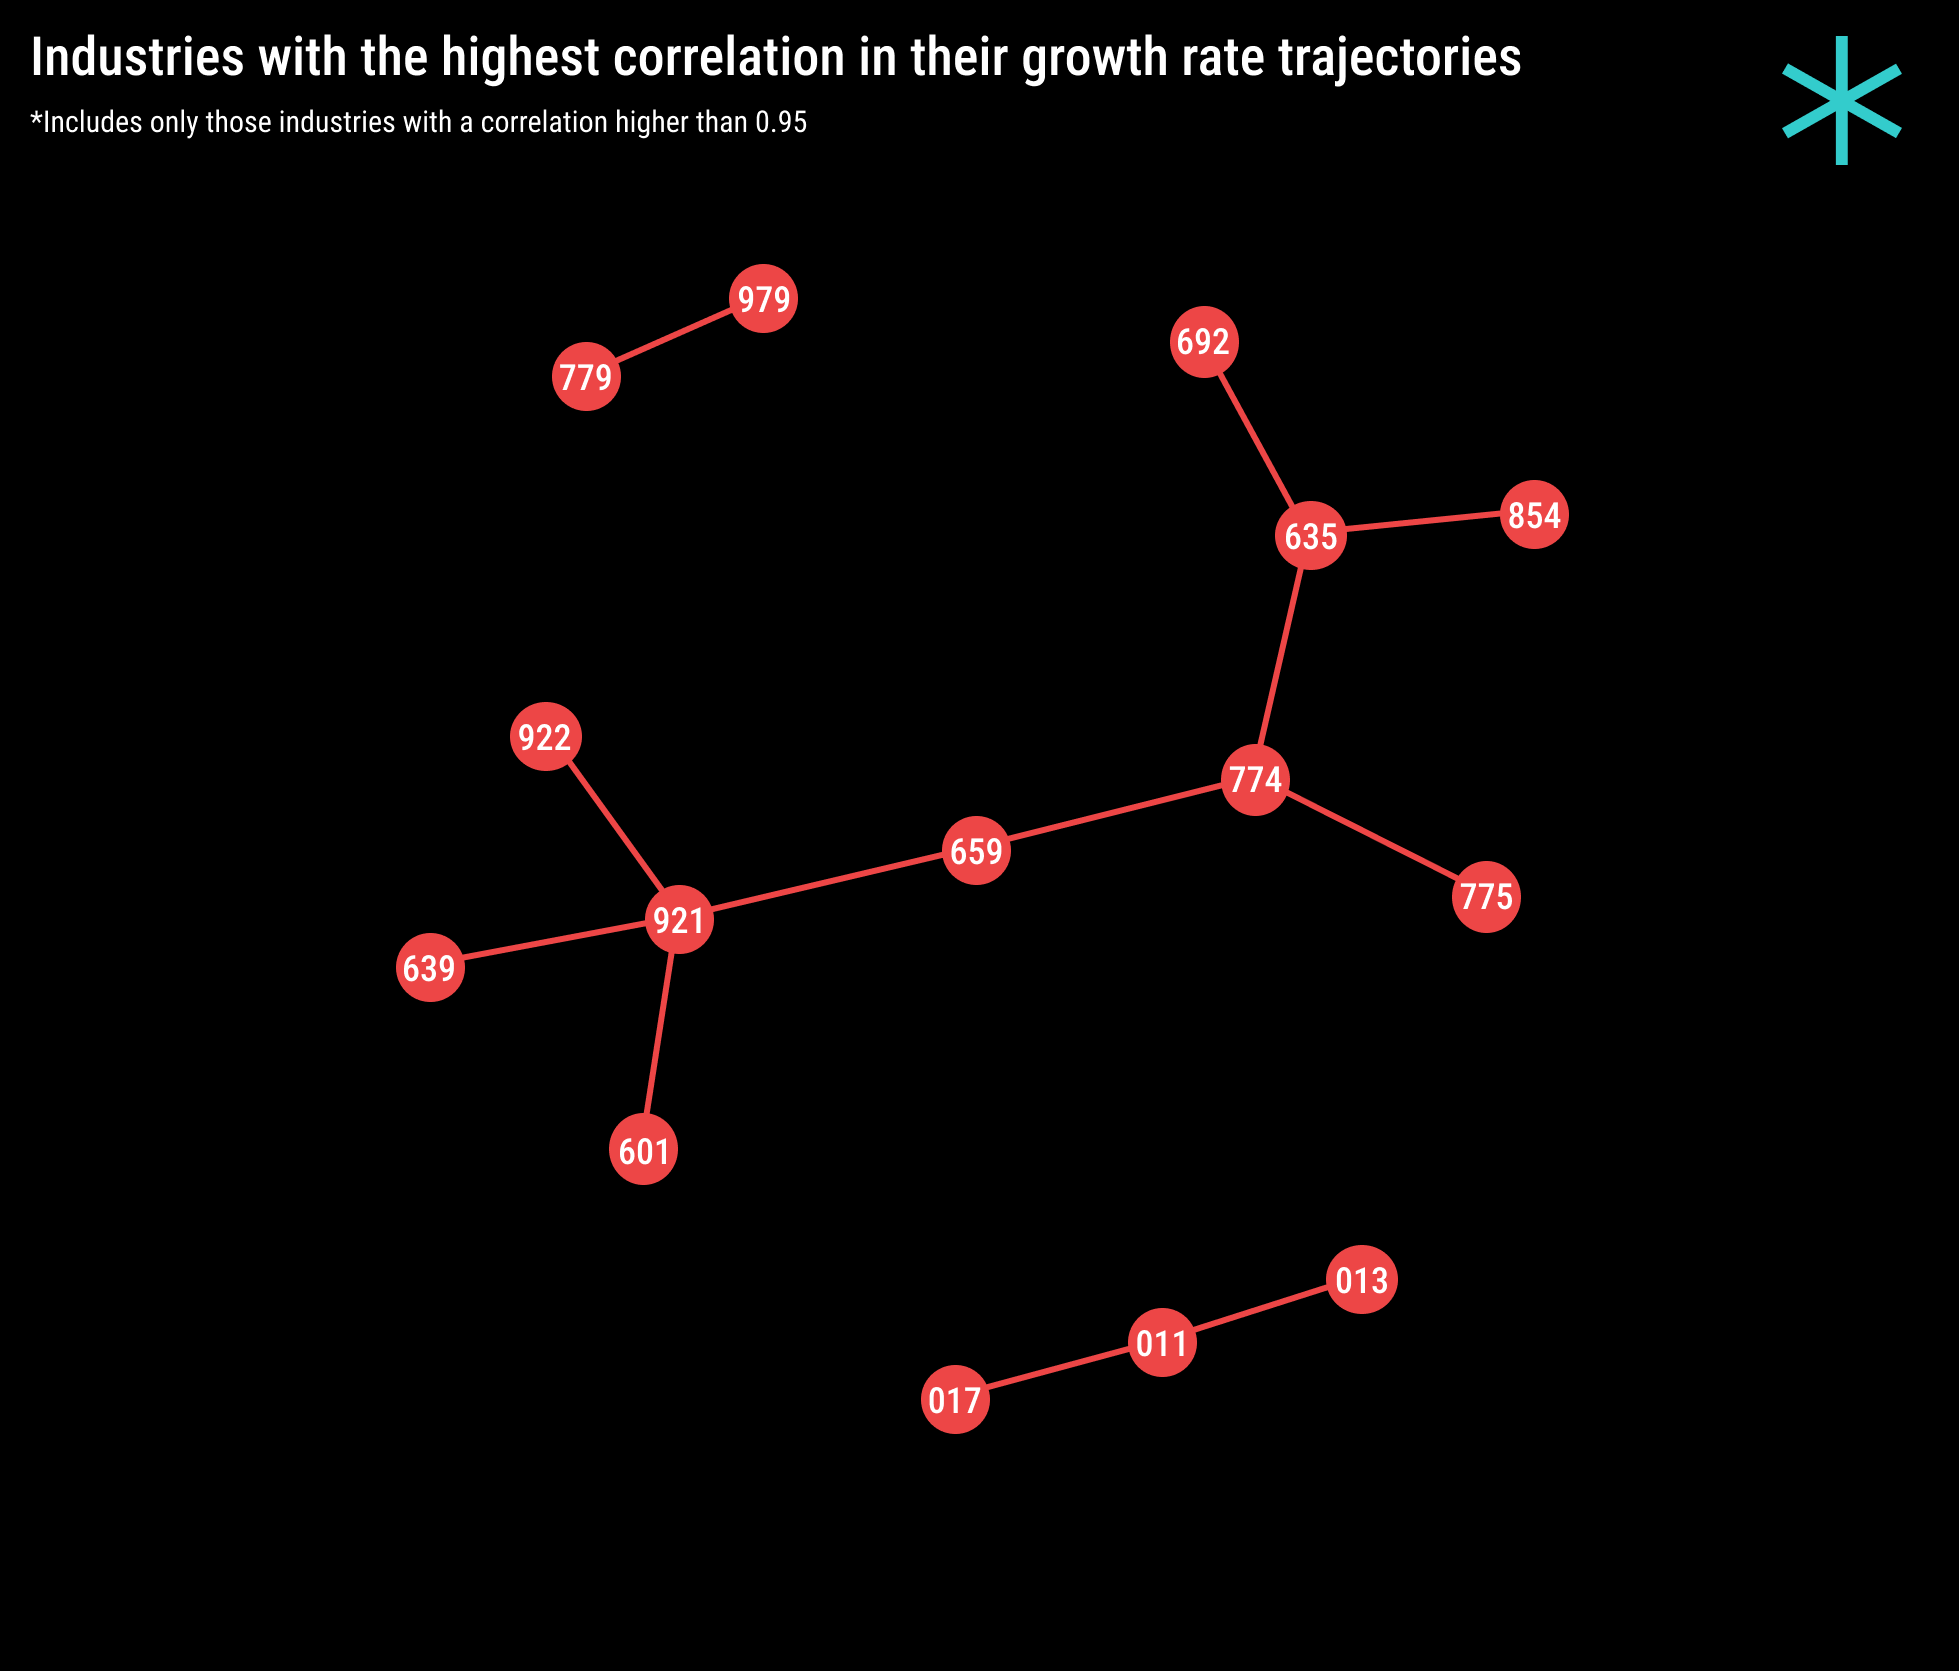
Community detection analysis is performed on the network graph above using the Louvain clustering algorithm to identify the most closely related clusters of industries within the general group. The algorithm does this by hierarchically measuring the difference between the average correlation of industries within a cluster and those outside of it, allowing for the assignment of nodes within each cluster.
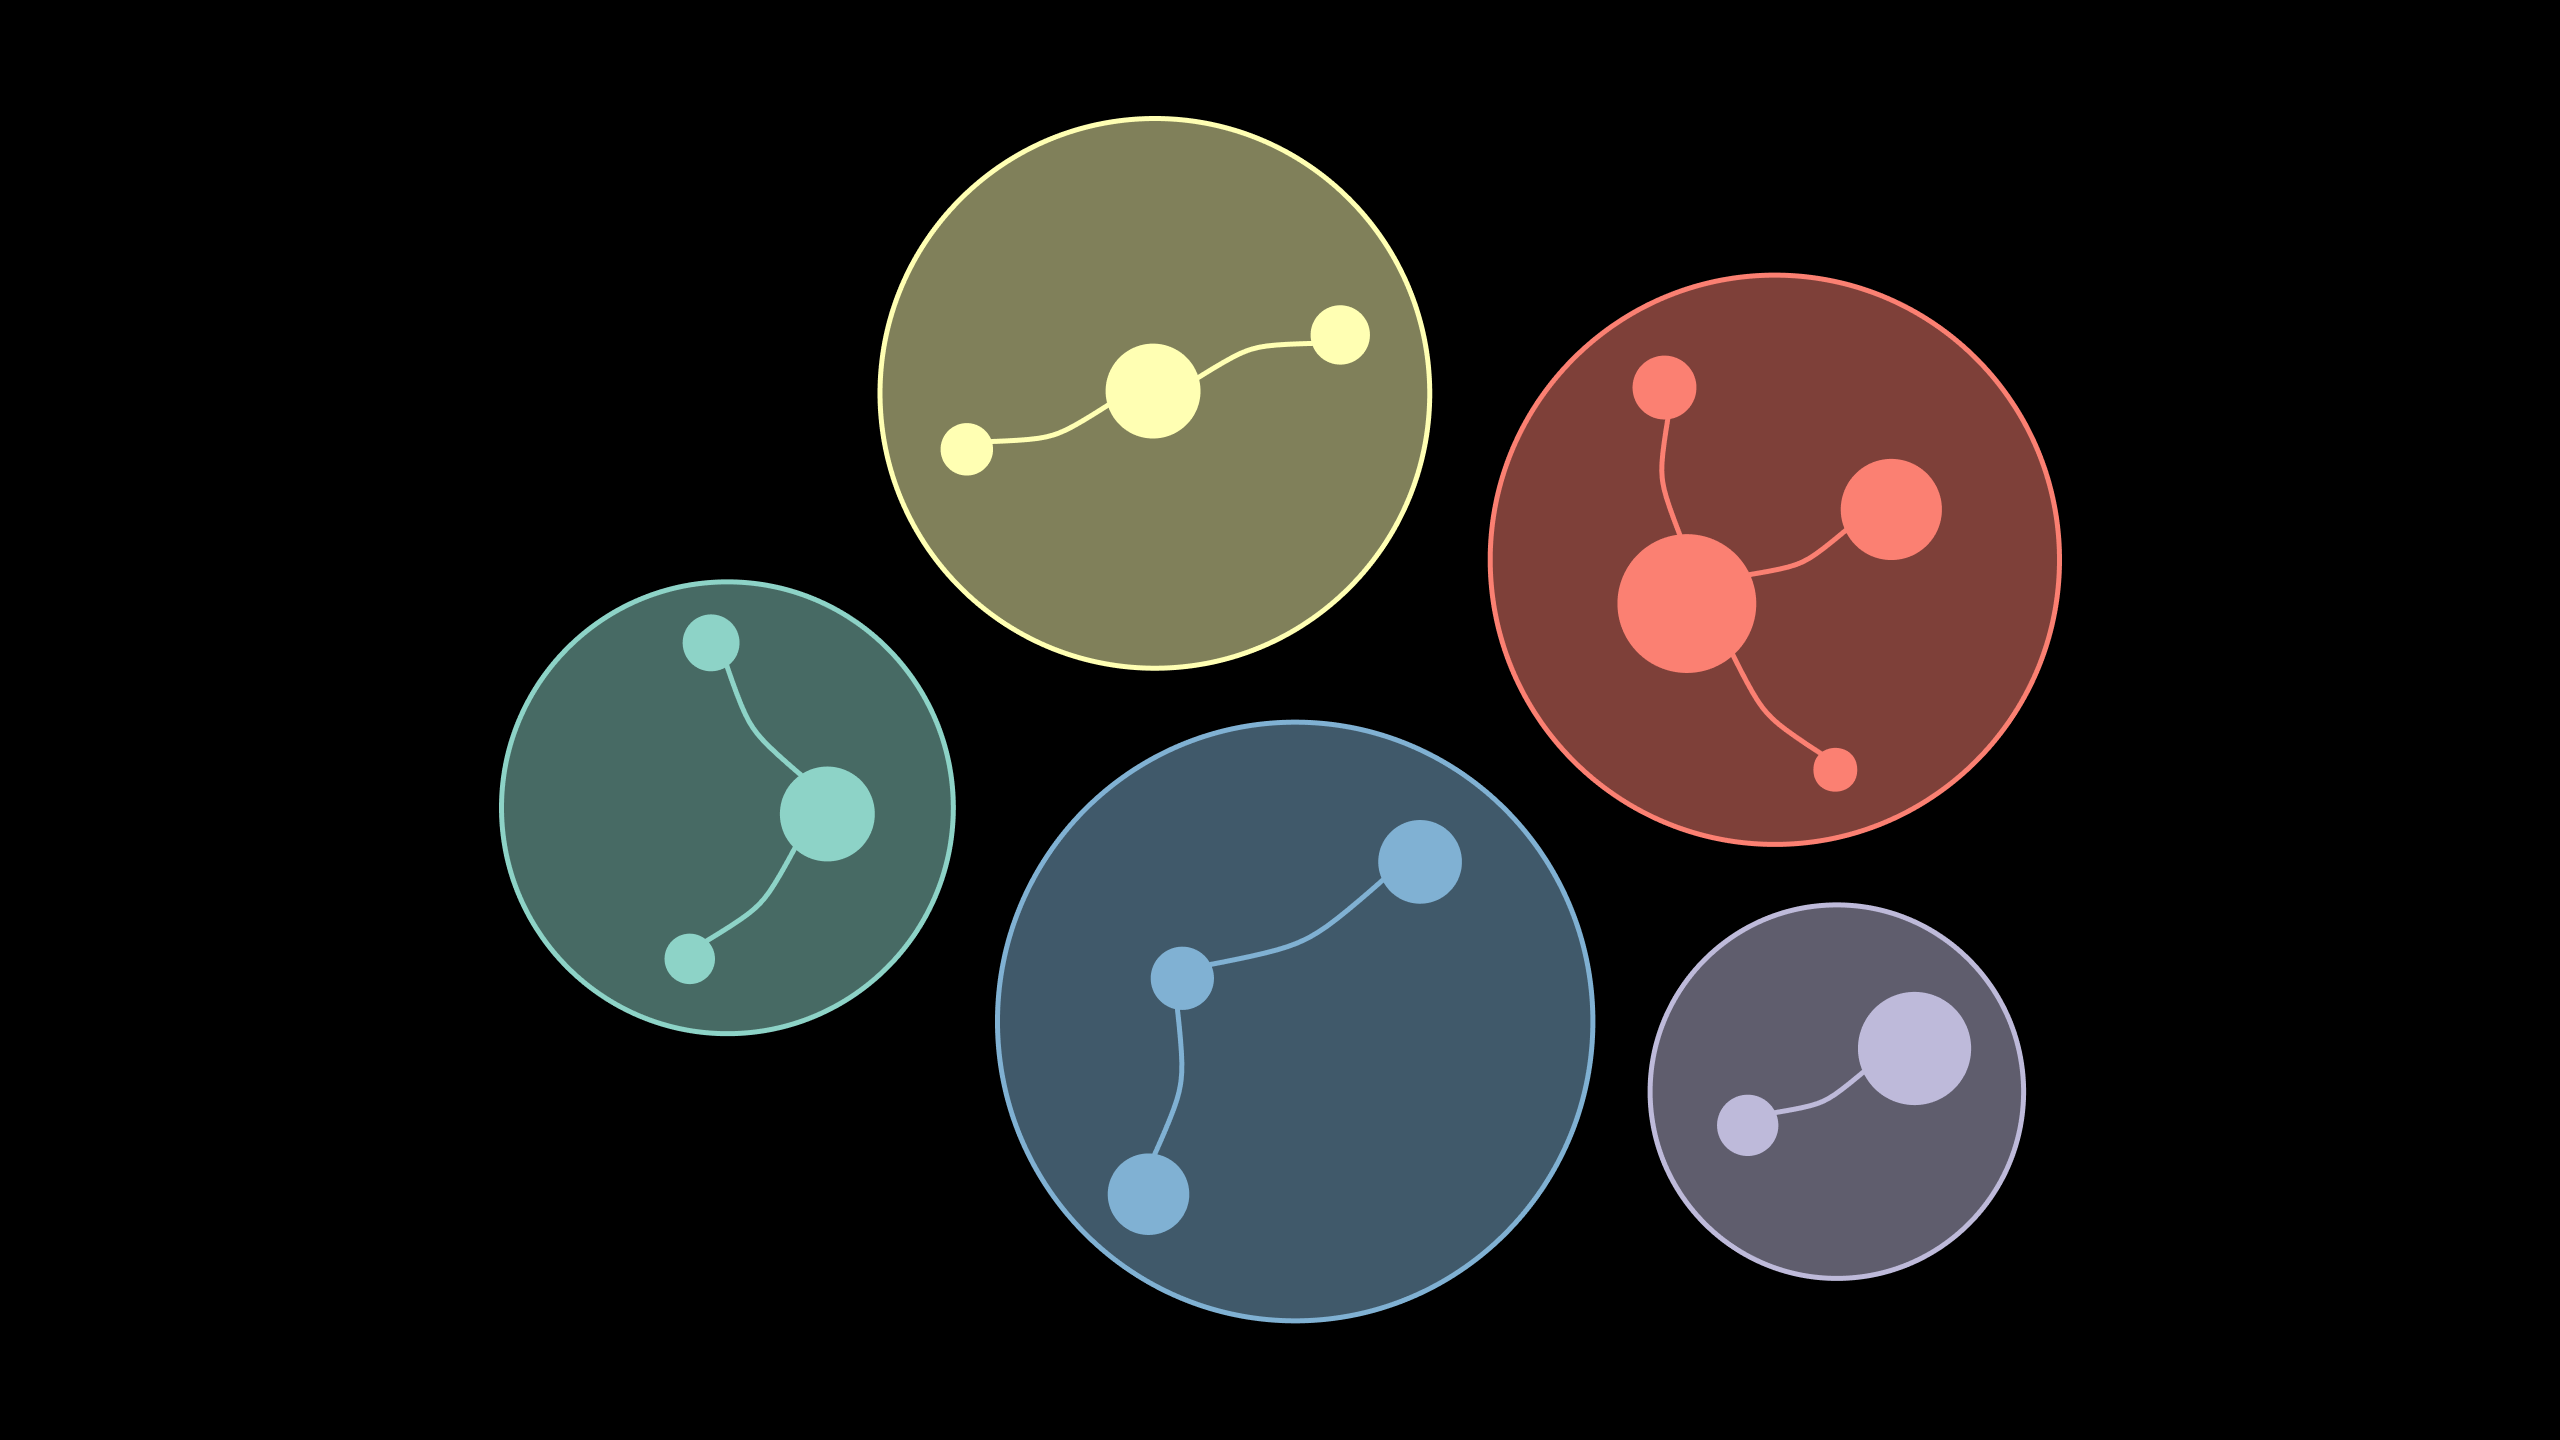
This results in five distinct clusters, as shown in the network graph below. The size of each node is proportional to the industry it represents. Broadly speaking, these clusters can be classified as Farming & Livestock, Food & Retail, Services & Training, Professional Services, and Other Services. The clustering algorithm largely groups related industries, though a few seemingly unrelated industries are also included. While this may initially seem counterintuitive, hidden linkages that are not immediately apparent may also be captured.

Next, the geographic distribution of identified clusters is determined at the census division level (MRC in Québec). A cluster is assumed to be present in an MRC if the number of employees within it exceeds the 90th percentile of the employment distribution. The following interactive map shows the presence of these clusters. The size of each cluster is proportional to the average size of the industries within it. A concentration of clusters within a particular MRC suggests that firms within a cluster also benefit from agglomeration economies with those outside their own cluster.
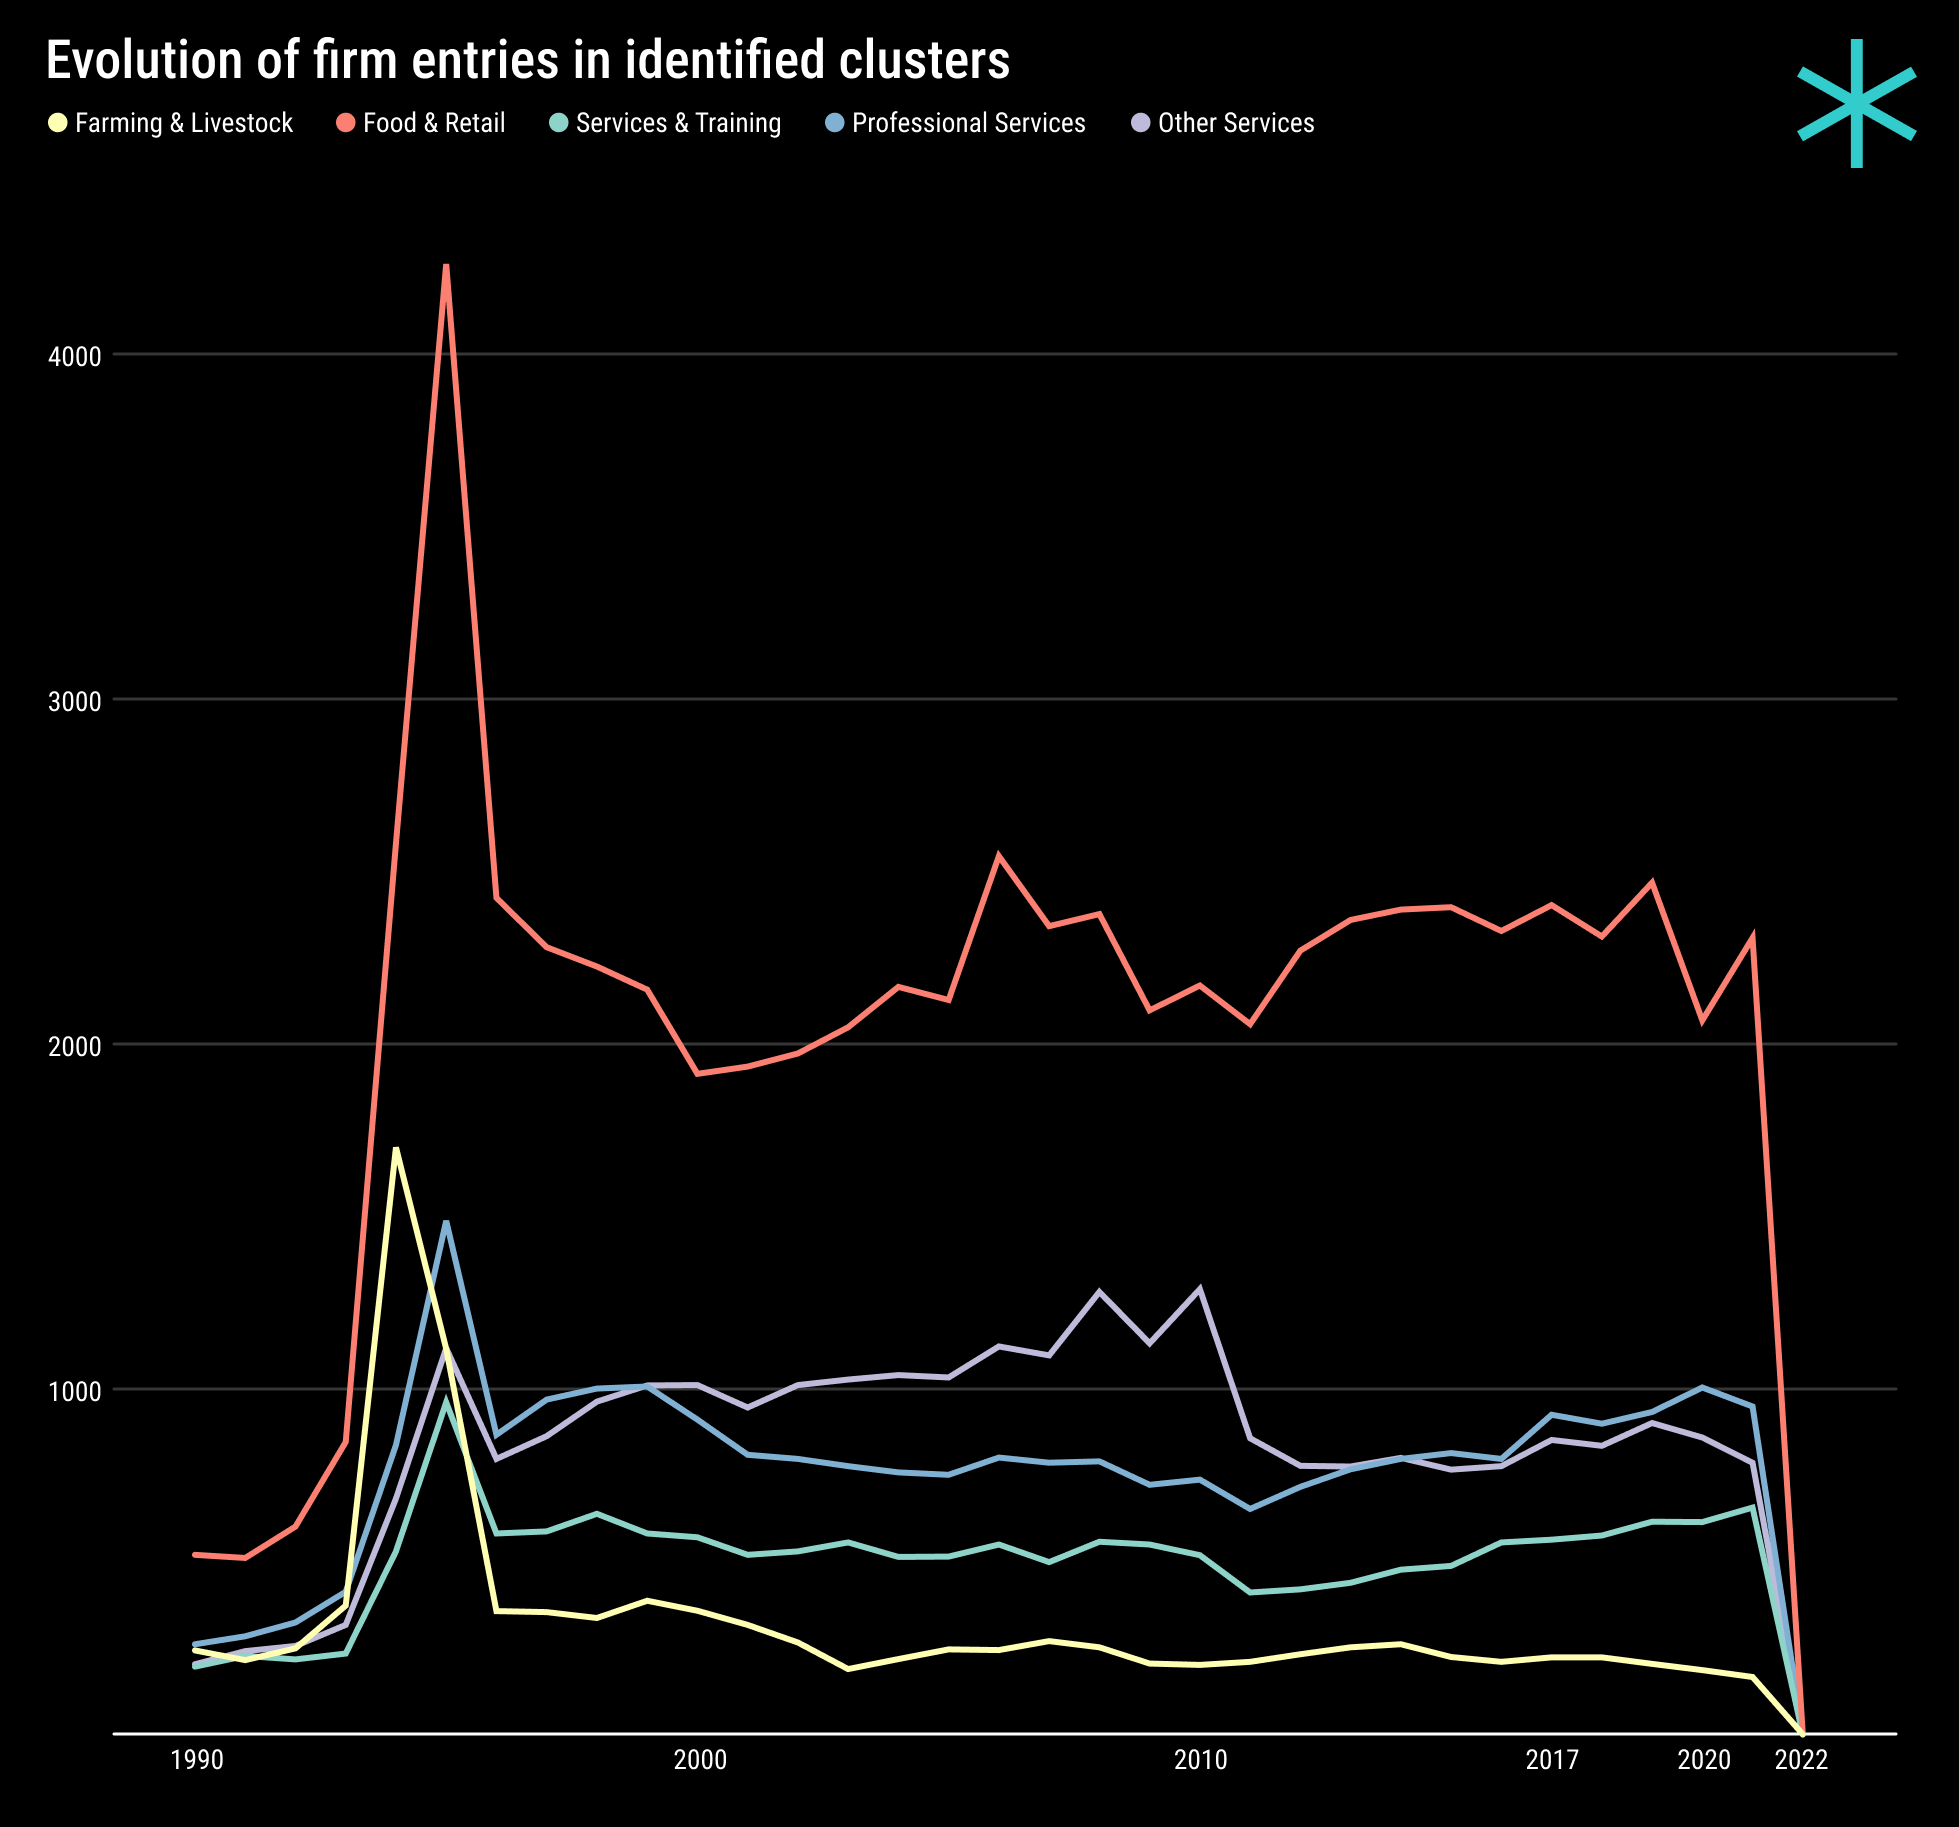
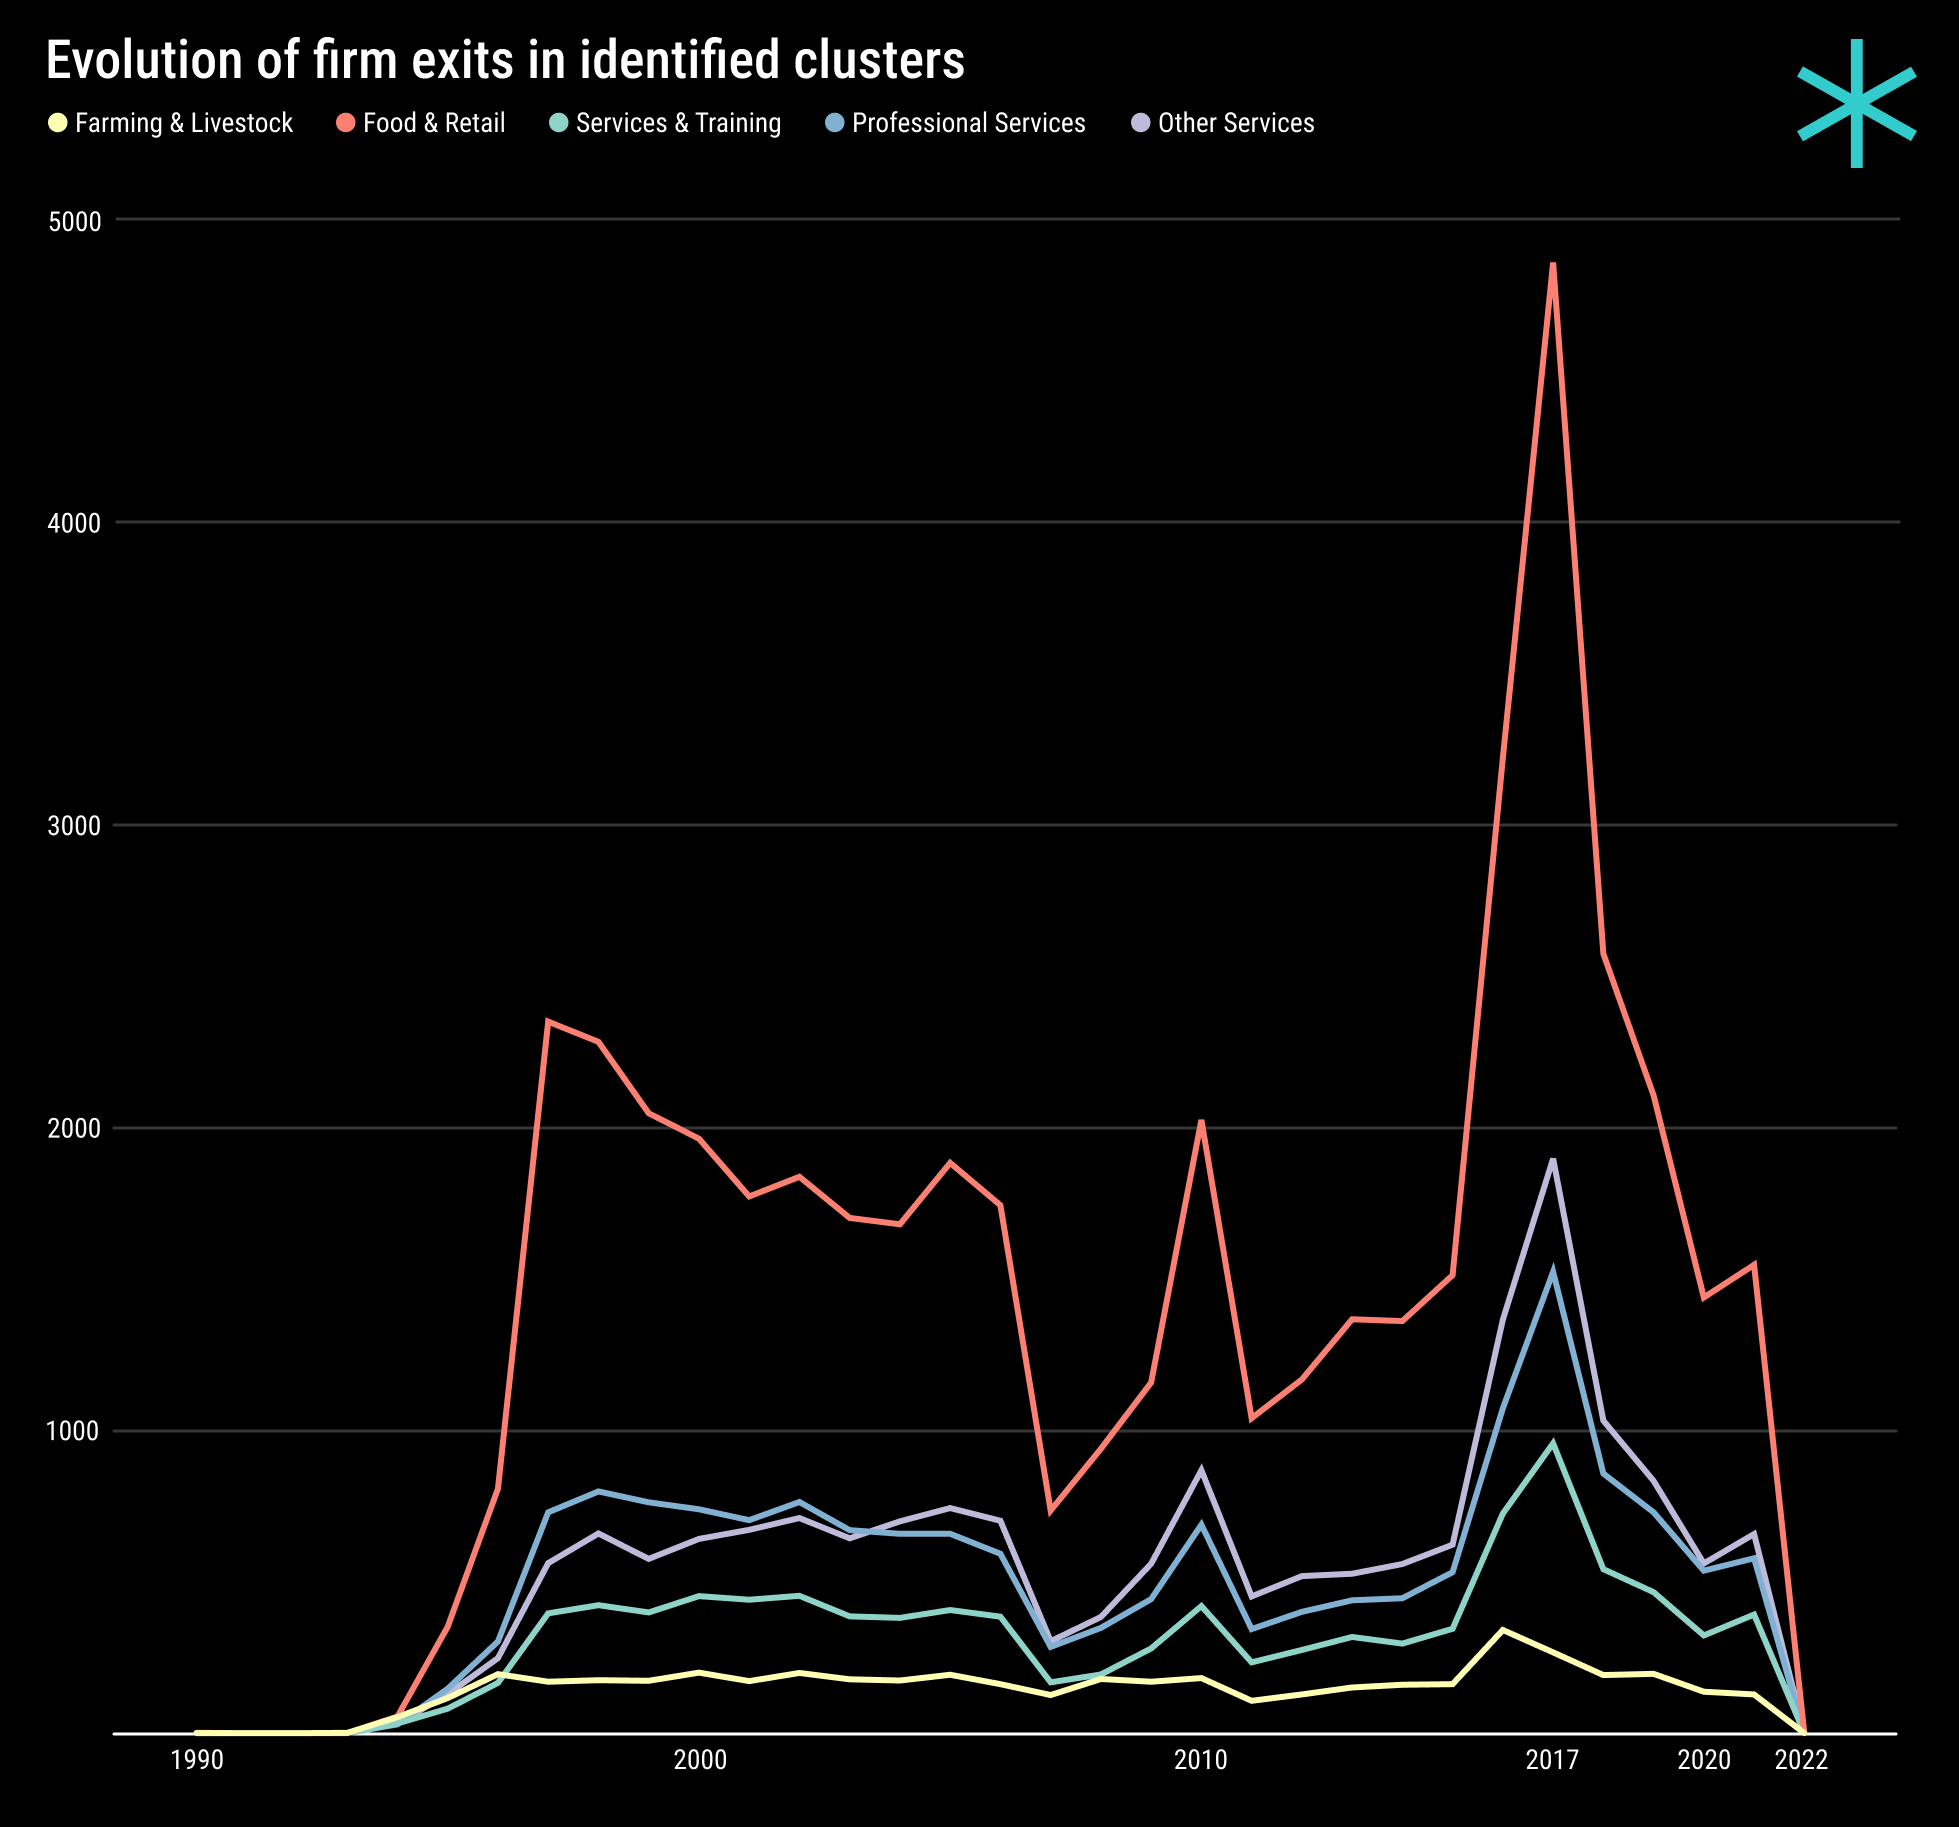
By turning to the temporal aspect of the REQ data, the evolution of clusters can be analyzed over time. This is computed by tracking the annual entry and exit of firms in each cluster. The clusters seem to exhibit generally similar patterns of growth, stagnation and decline. However, the Food & Retail cluster grows at a faster pace than the others. In contrast, the Farming and Livestock cluster shows a flatter trajectory, likely due to the regulated nature of the industry and the inelasticity of its output.
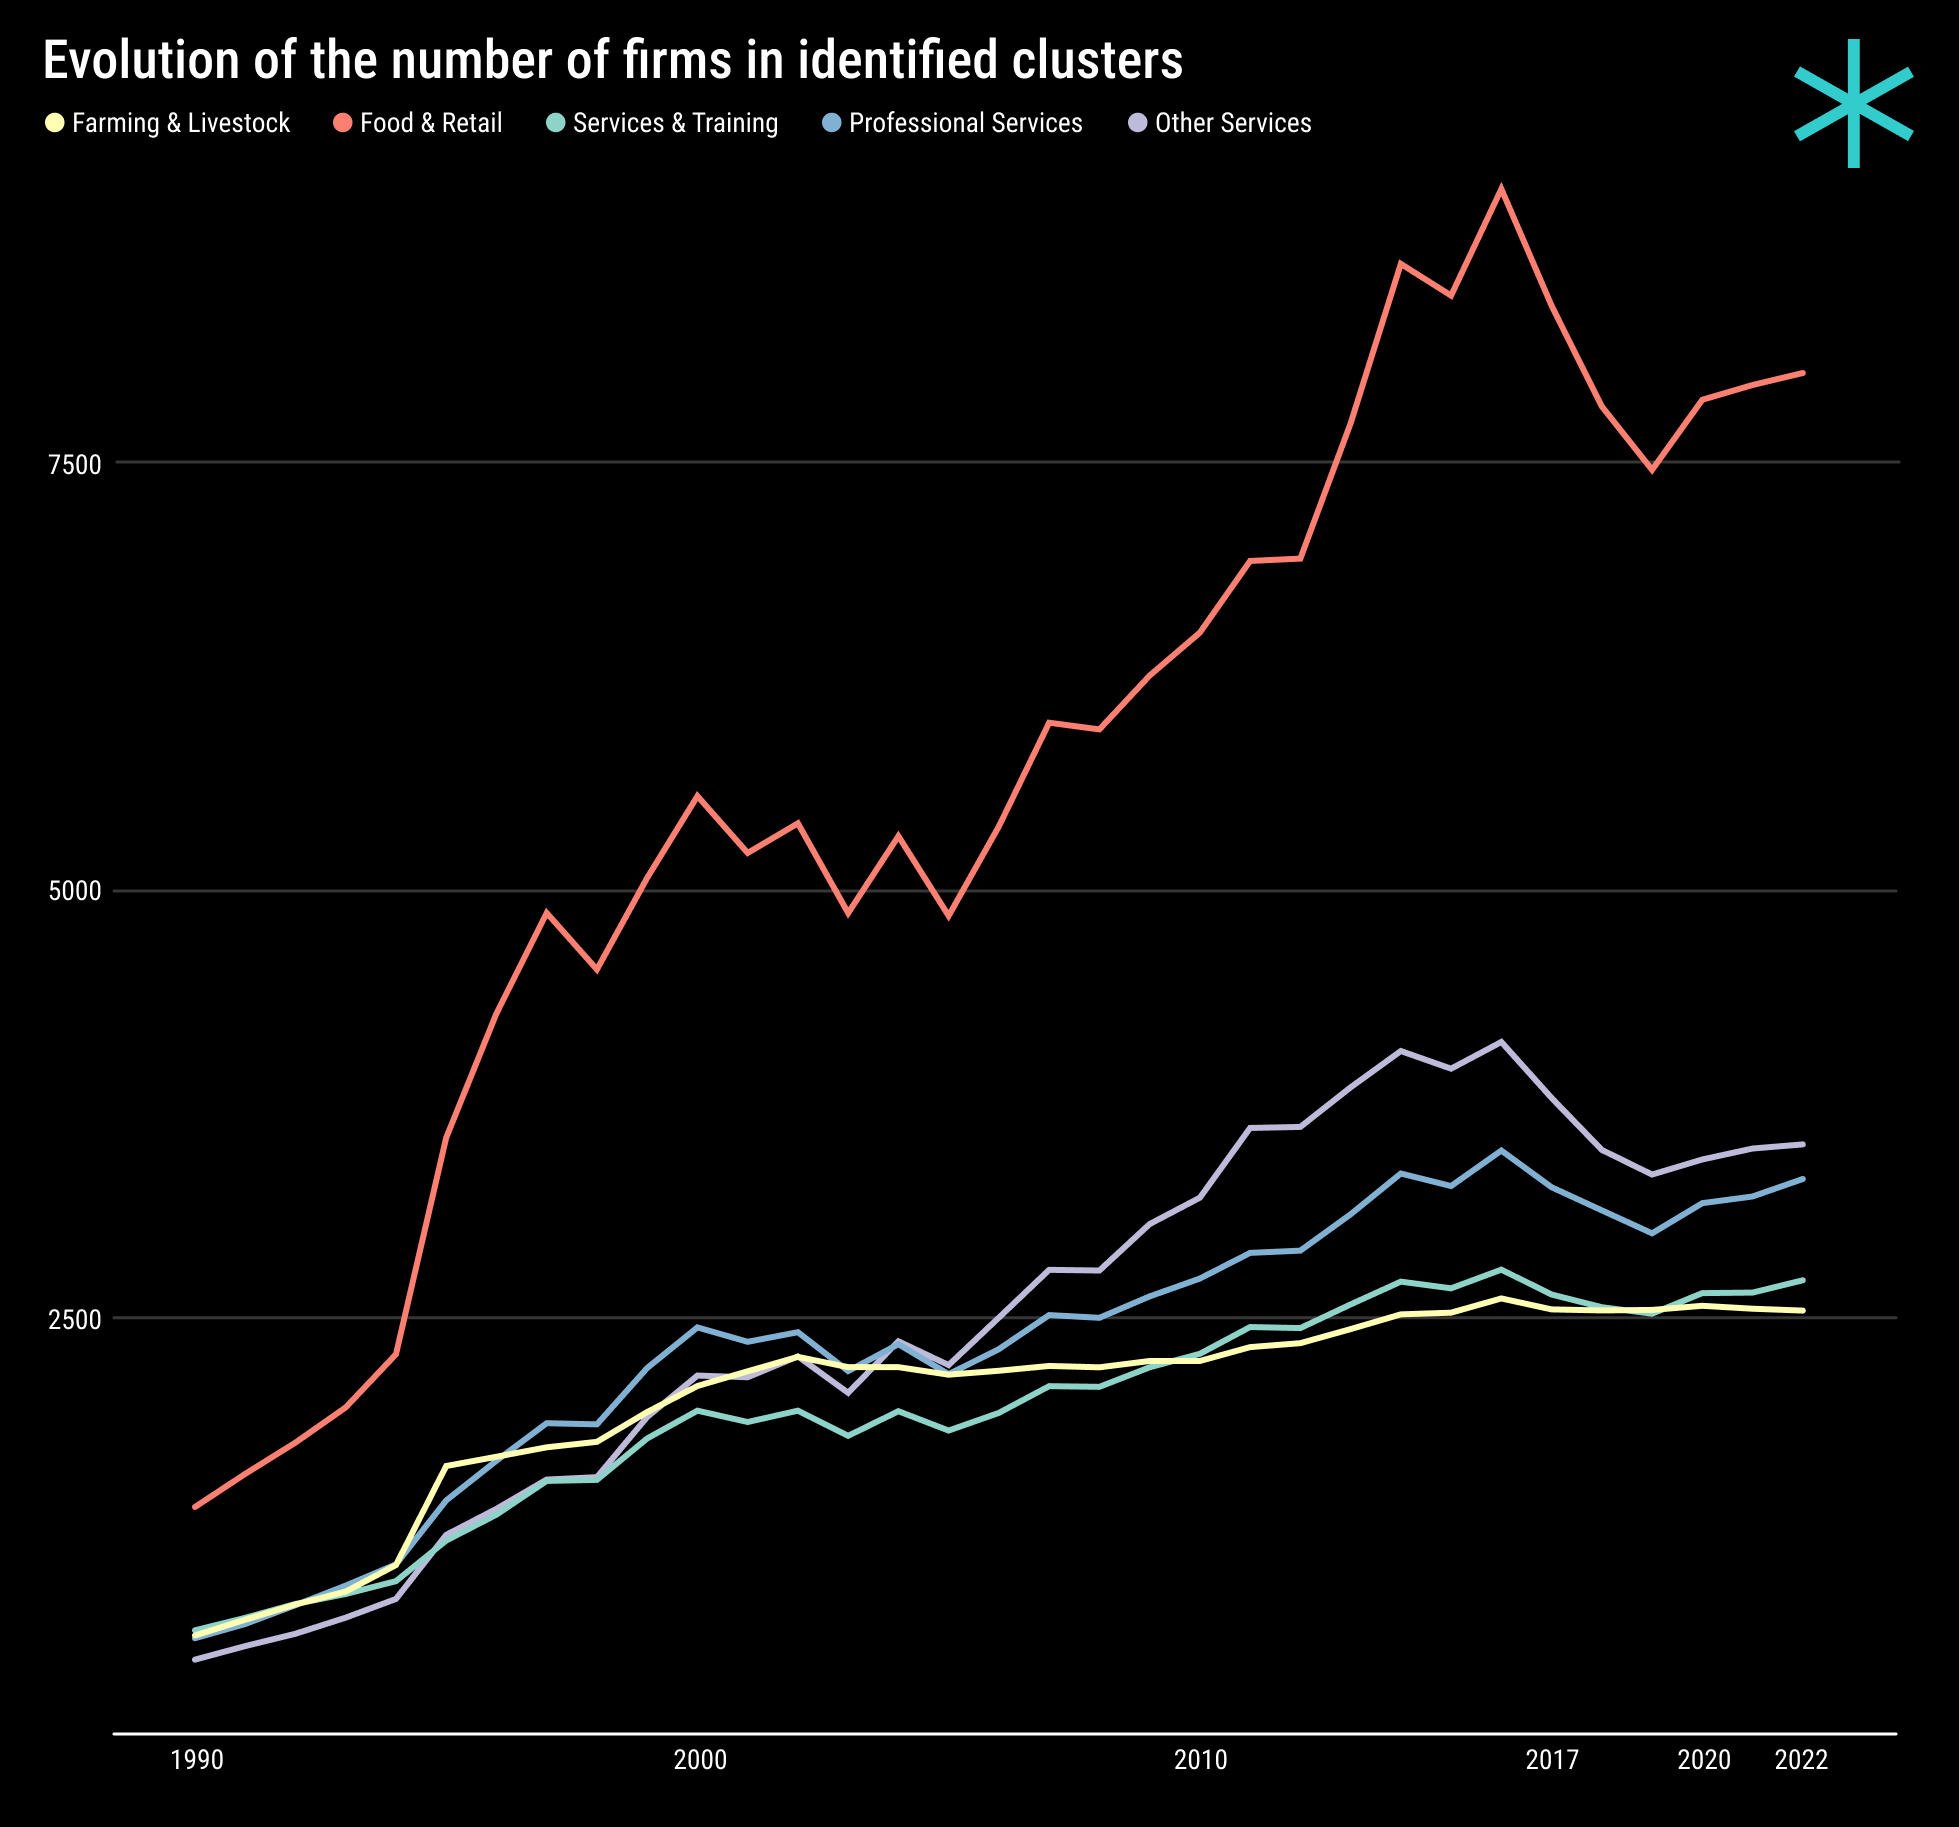
Focusing on firm entries reveals that entries peaked across all identified clusters in the mid-1990s. Since then, the annual number of firms entering the market has remained relatively stable. The Food & Retail cluster shows greater variation relative to others, with between 2,000 and 2,500 annual entrants since the early 2000s. In contrast, the Other Services cluster has seen fewer entrants since 2011. The abrupt decrease in 2022 may be attributable to the cutoff in the data compiled from the REQ.
On the other hand, firm exits appear to have climbed sharply shortly after the peak in firm entries during the mid-1990s. While 2017 saw the highest number of closures across clusters, there was also a shorter peak in 2010. The numbers have since been trending back down toward their usual levels.
In essence, the preliminary results reveal the presence of emergent clusters that provide valuable insights into industrial distribution and inter-industry dynamics. The co-movement of individual industries within the identified clusters underscores their significance to the regional economy and highlights the necessity for context-specific support to ensure their continued growth. Further investigation will focus on validating these results and exploring potential policy interventions that could strengthen these dynamically identified clusters and promote sustainable growth.
