Trade diversification is high on Canada’s policy agenda but how we measure it matters. At the country level, the picture looks straightforward as the U.S. towers over every other market. But it is important to remember that it is businesses that trade, not countries.
At the firm level, diversification is often idiosyncratic and is shaped by industry, networks and resources. Aggregating firms by their employment size smooths over this complexity, but still provides a useful middle layer. It shows how small, medium and large exporters contribute differently to Canada’s trade profile.
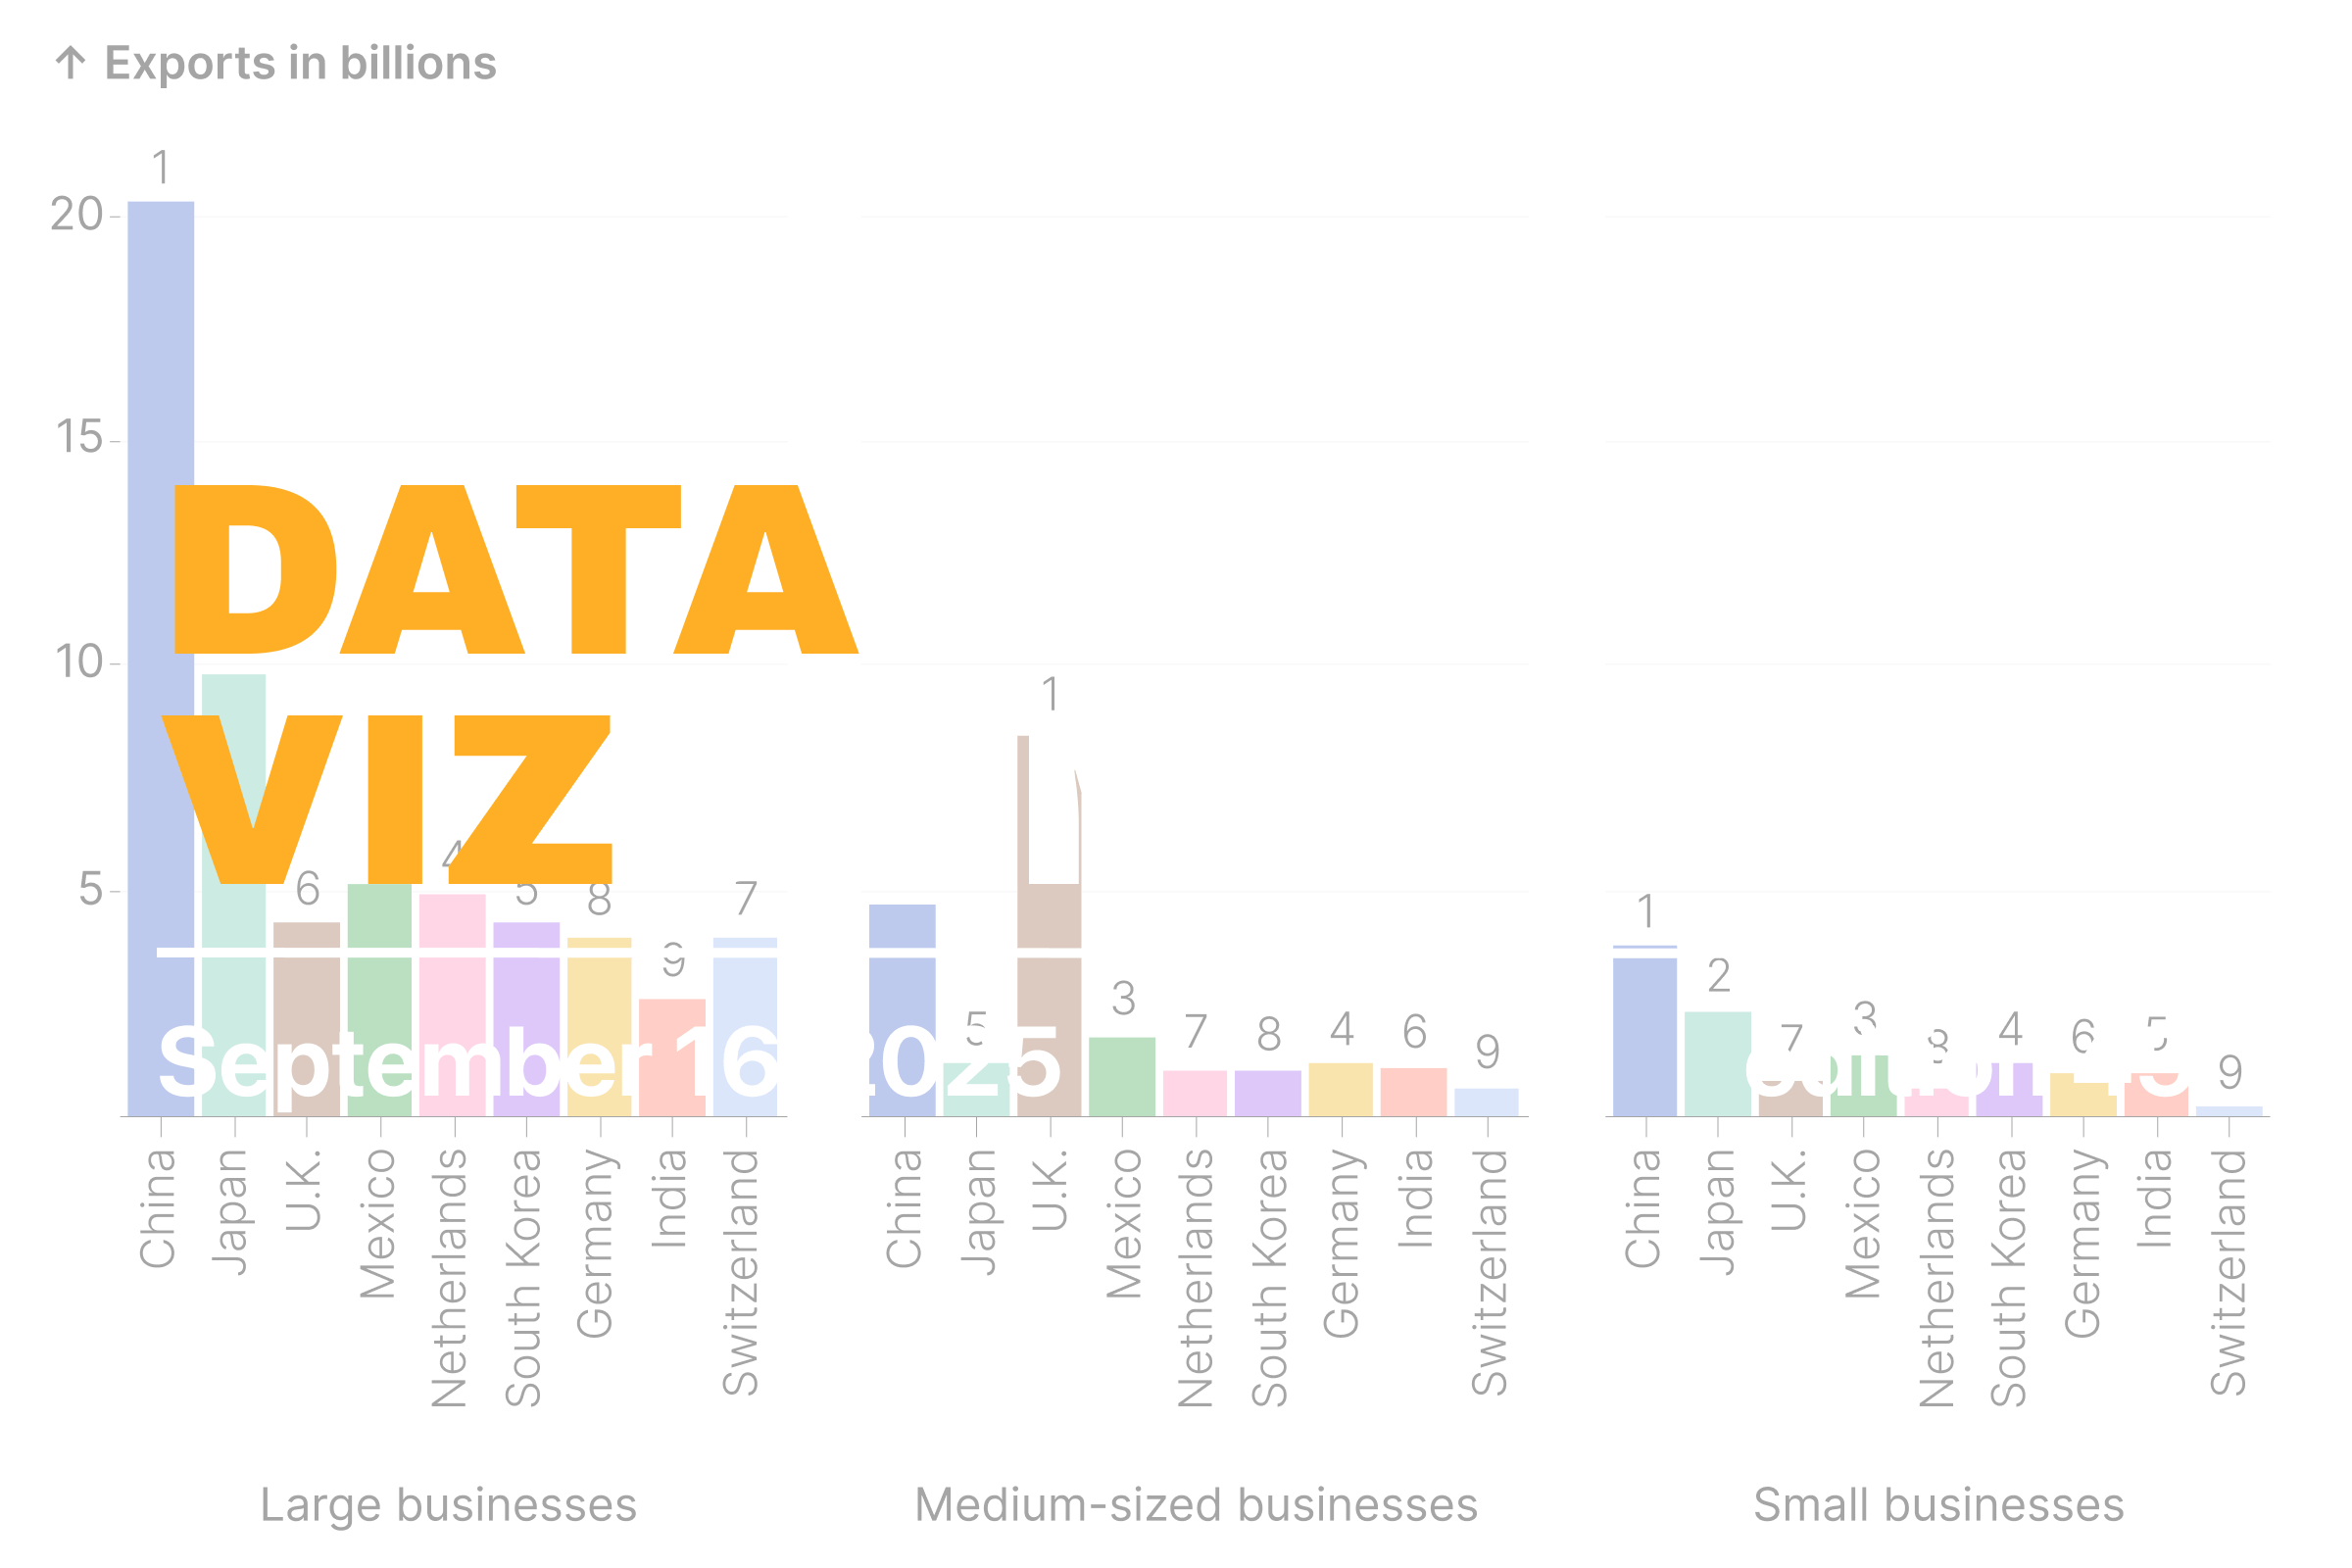
Even then, the overall picture of diversification barely shifts. In 2023, every size of Canadian firm relied overwhelmingly on the U.S., with exports to that market making up three-quarters of their total value. The chart below turns to Canada’s next nine export markets worth about 95 billion dollars and looks at how they matter to firms of different sizes, shown by the ranks above the bars.
This is where the cracks in the aggregate appear. Here, differences by firm size emerge as some markets matter more for small firms, others for large ones. China for example is the largest market for large and small businesses, as compared to the U.K. for medium-sized businesses.
This underscores a drawback of relying solely on aggregate measures. They conceal how the structure of trade varies beneath the surface. True diversification, like in finance, depends not just on how many markets firms trade with, but on whether those markets rise and fall together. Looking at exports through this portfolio lens could change how we think about resilience in Canadian trade.
Data Vizdom digs into ideas big and small through visualizations that help make sense of a changing world, drawing on data from the SLGL dataHub.