Rails are a vital component of Canadian logistics, providing a reliable and cost-effective way to move goods across large distances. In 2024, the rail system supported merchandise trade valued at $1.55 trillion, with a 0.9 percent uptick in network-wide traffic. This growth was tempered by labour strikes at both major rail carriers and at the Ports of Montreal and Vancouver. Broader economic and geopolitical instability also played a part, affecting the pace of trade.
As economies become tightly linked through global value chains, disruptions can spiral outward and ripple across borders and industries. The ongoing tariff negotiations with the U.S. have added further uncertainty for businesses on both sides of the border. For those trying to read the signals, even monthly trade data, typically released with a five-week lag, obscures the complexity of supply chains and quickly goes stale as an indicator of trade activity.
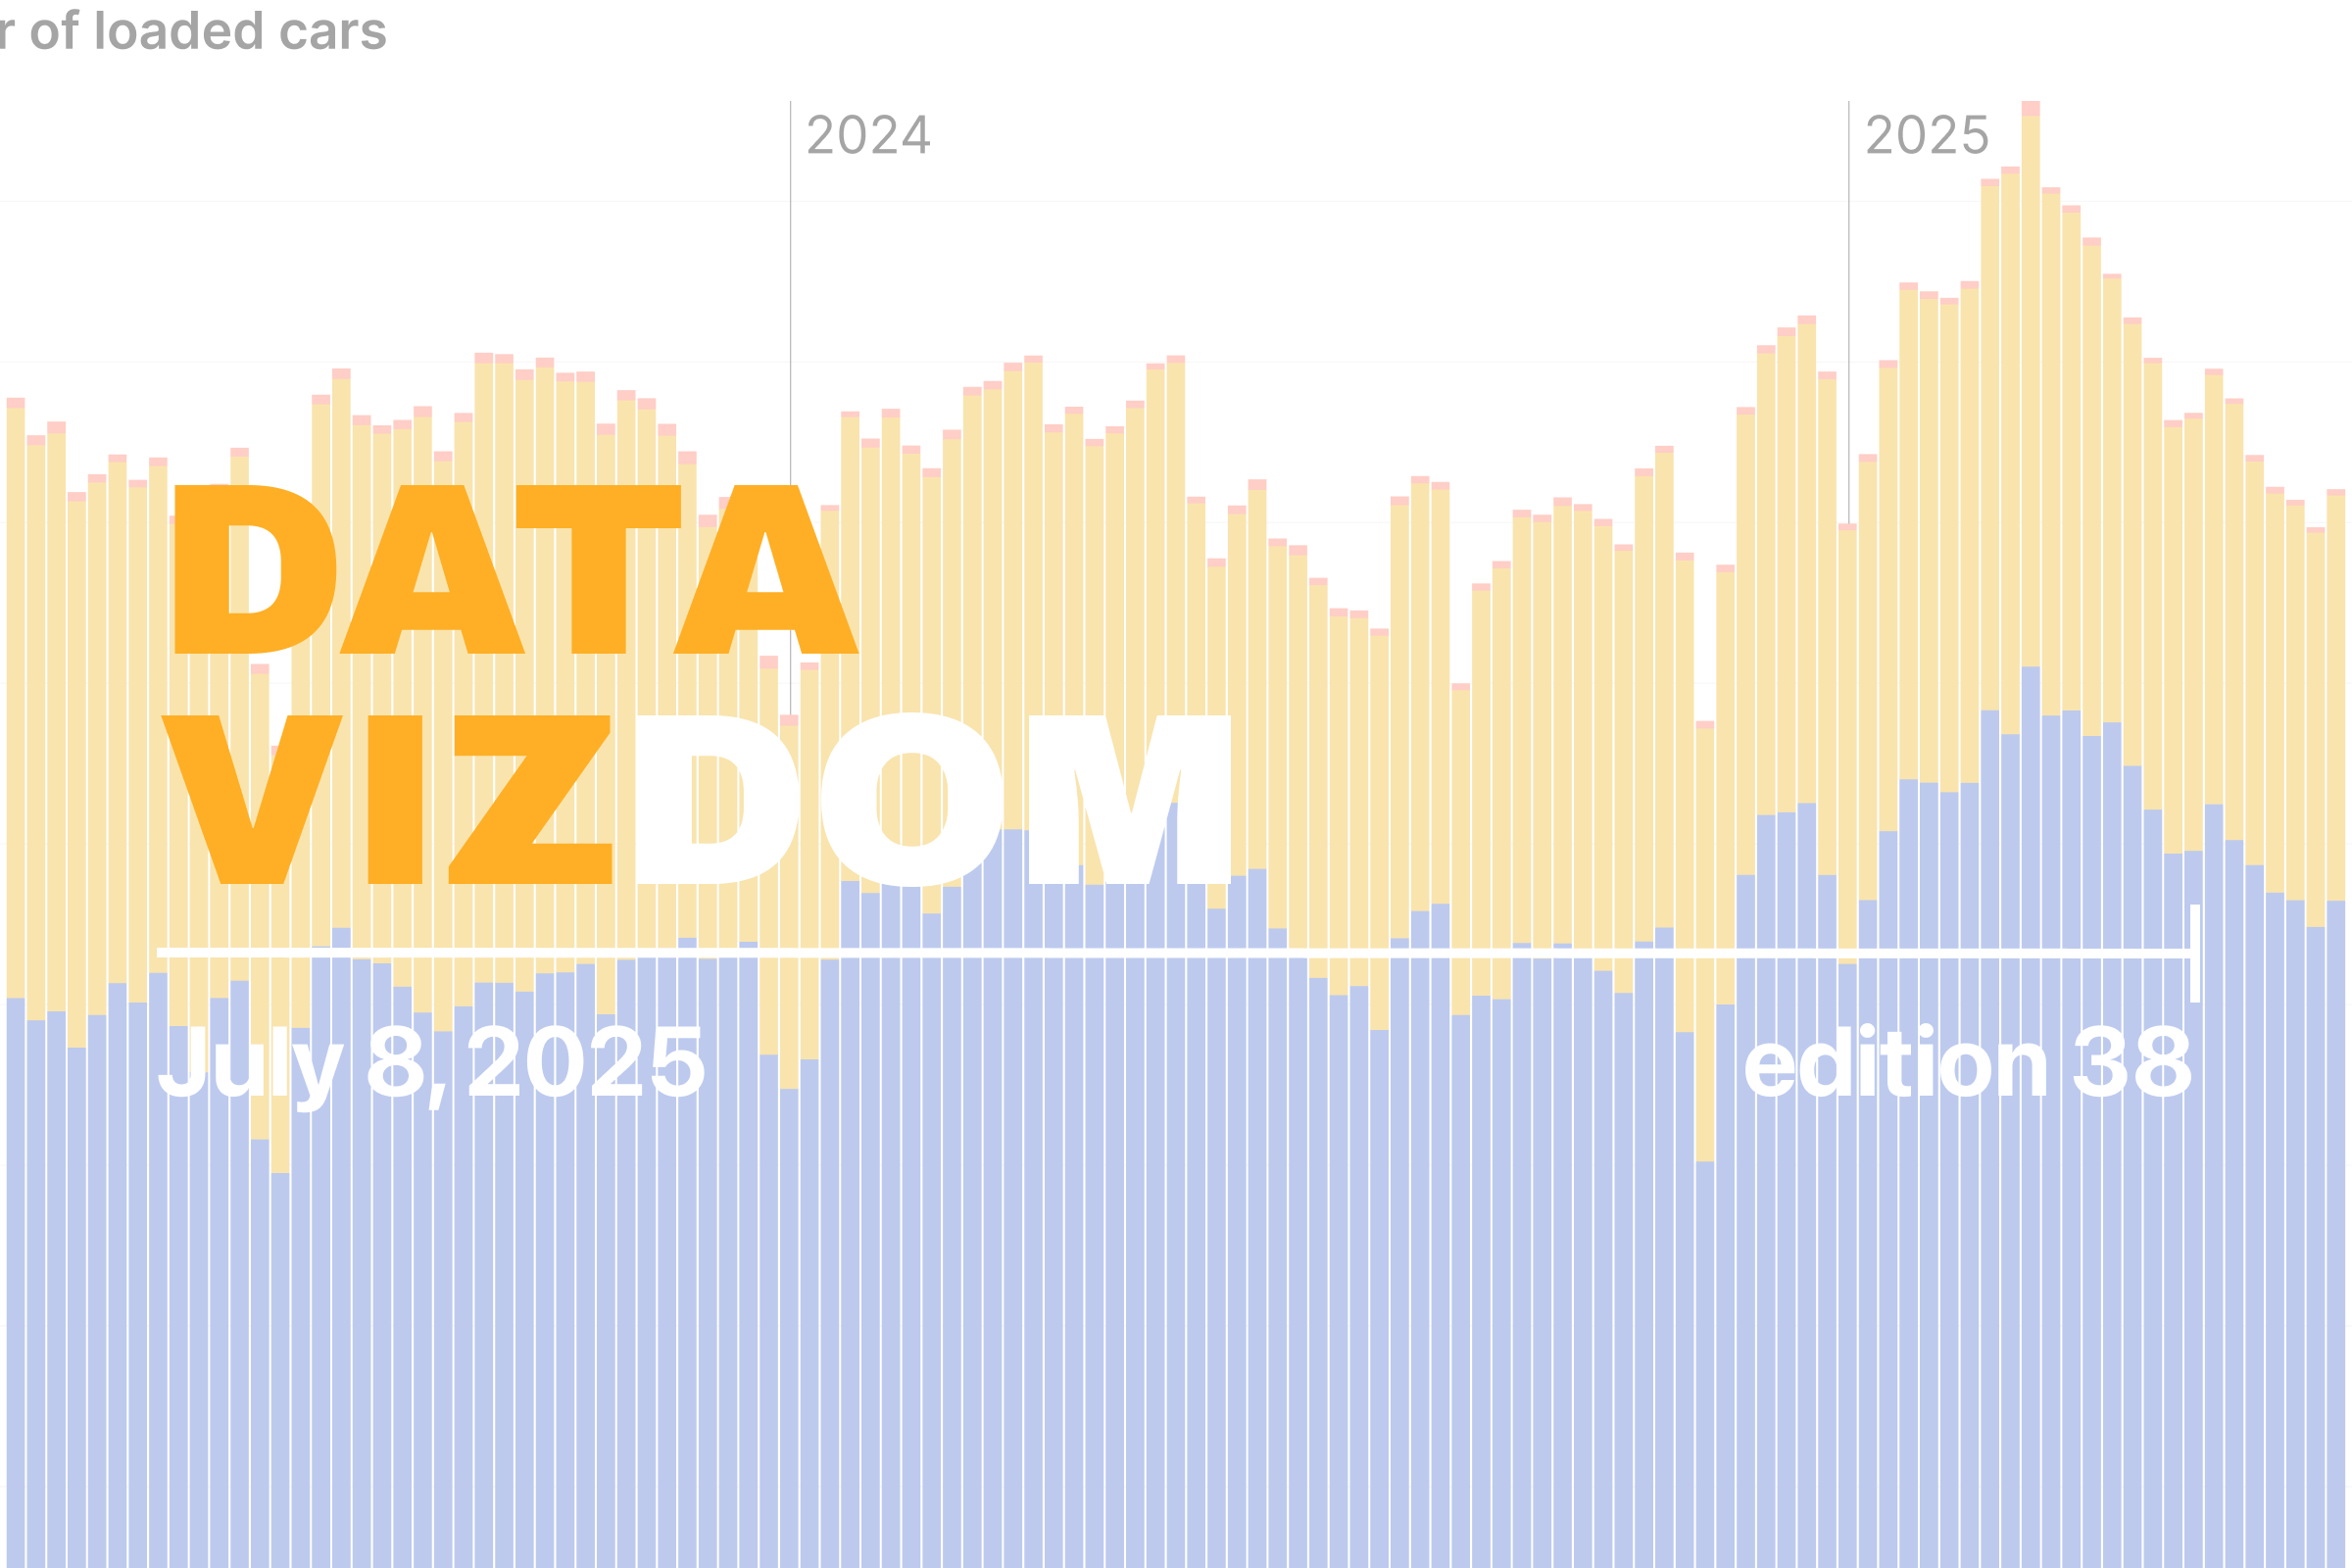
The interactive chart below provides a near real-time snapshot of weekly average loaded railcars in Canada. While it does not include shipment weight or origin-destination details, it reveals what commodities are moving and which carriers are moving them. Compared to traditional trade statistics, this view offers more timely insight into shifting freight patterns and logistics activity.
The data for network-wide traffic shows a downturn from strikes and economic uncertainty in the second half of 2024. The carrier-wise proportion has stayed consistently in the mid-to-high 60s for CN since 2024, showing a cannibalization of share from CPKC. In terms of absolute traffic, numbers were very high at the beginning of 2025 as businesses front-loaded orders due to tariffs. More recent weeks show a sharp decline, though the number remains slightly higher year-over-year.
Regarding commodities being moved, containerized traffic is by far the largest in terms of the number of cars, followed by cars carrying chemicals and plastics, and Western grain. Containerized traffic has been trending over 50% since the start of 2025, a higher weekly proportion than in 2024. Aside from Western grain and agriculture & food, other commodities have remained relatively consistent in proportion since April 2023.
Province-level data shows the regional fluctuations in traffic, carrier shares, and commodities moved. The recent downturn has been most pronounced in Saskatchewan, followed by Quebec and Ontario. While the decline is smaller in Alberta and British Columbia, they still represent a larger number of railcars than in Saskatchewan or Quebec.
As trade flows remain in flux, tracking what moves on the rails offers a valuable early signal. With shifting commodity patterns and regional variations, freight rail data provides timely insight into how Canada’s supply chains are adapting in real time.
Data Vizdom digs into ideas big and small through visualizations that help make sense of a changing world, drawing on data from the SLGL dataHub.