Statistics Canada’s March 2025 trade data marks the first measurable impact of new U.S. tariffs on Canadian steel, aluminum, and non-CUSMA-compliant goods. Their monthly report shows a 0.2% month-over-month decline in seasonally adjusted exports, totalling $69.9 billion, while imports fell by 1.5% to $70.4 billion compared to February 2025. However, on a year-on-year basis, exports were up by 10.2% compared to March 2024.
A key finding of the March report is the sharp month-to-month shift in export destinations. Between February and March 2025, exports to the U.S. fell 6.6%, while exports to other markets surged by 24.8%, nearly offsetting the American decline. But is this a sign of Canadian exporters pivoting away from the U.S.? To test this, we compare product-level export data for March 2025 and March 2024 under several scenarios.
In aggregate terms, non-seasonally adjusted exports rose 13.1% year-over-year to $72.74 billion in March 2025. Crucially, the U.S. share of Canada’s total exports remained virtually unchanged at 75% over the year. This means that while non-U.S. markets saw large absolute gains, these gains did not come at the expense of U.S. market share. Which means that export growth has been additive rather than substitutive for Canadian exporters.
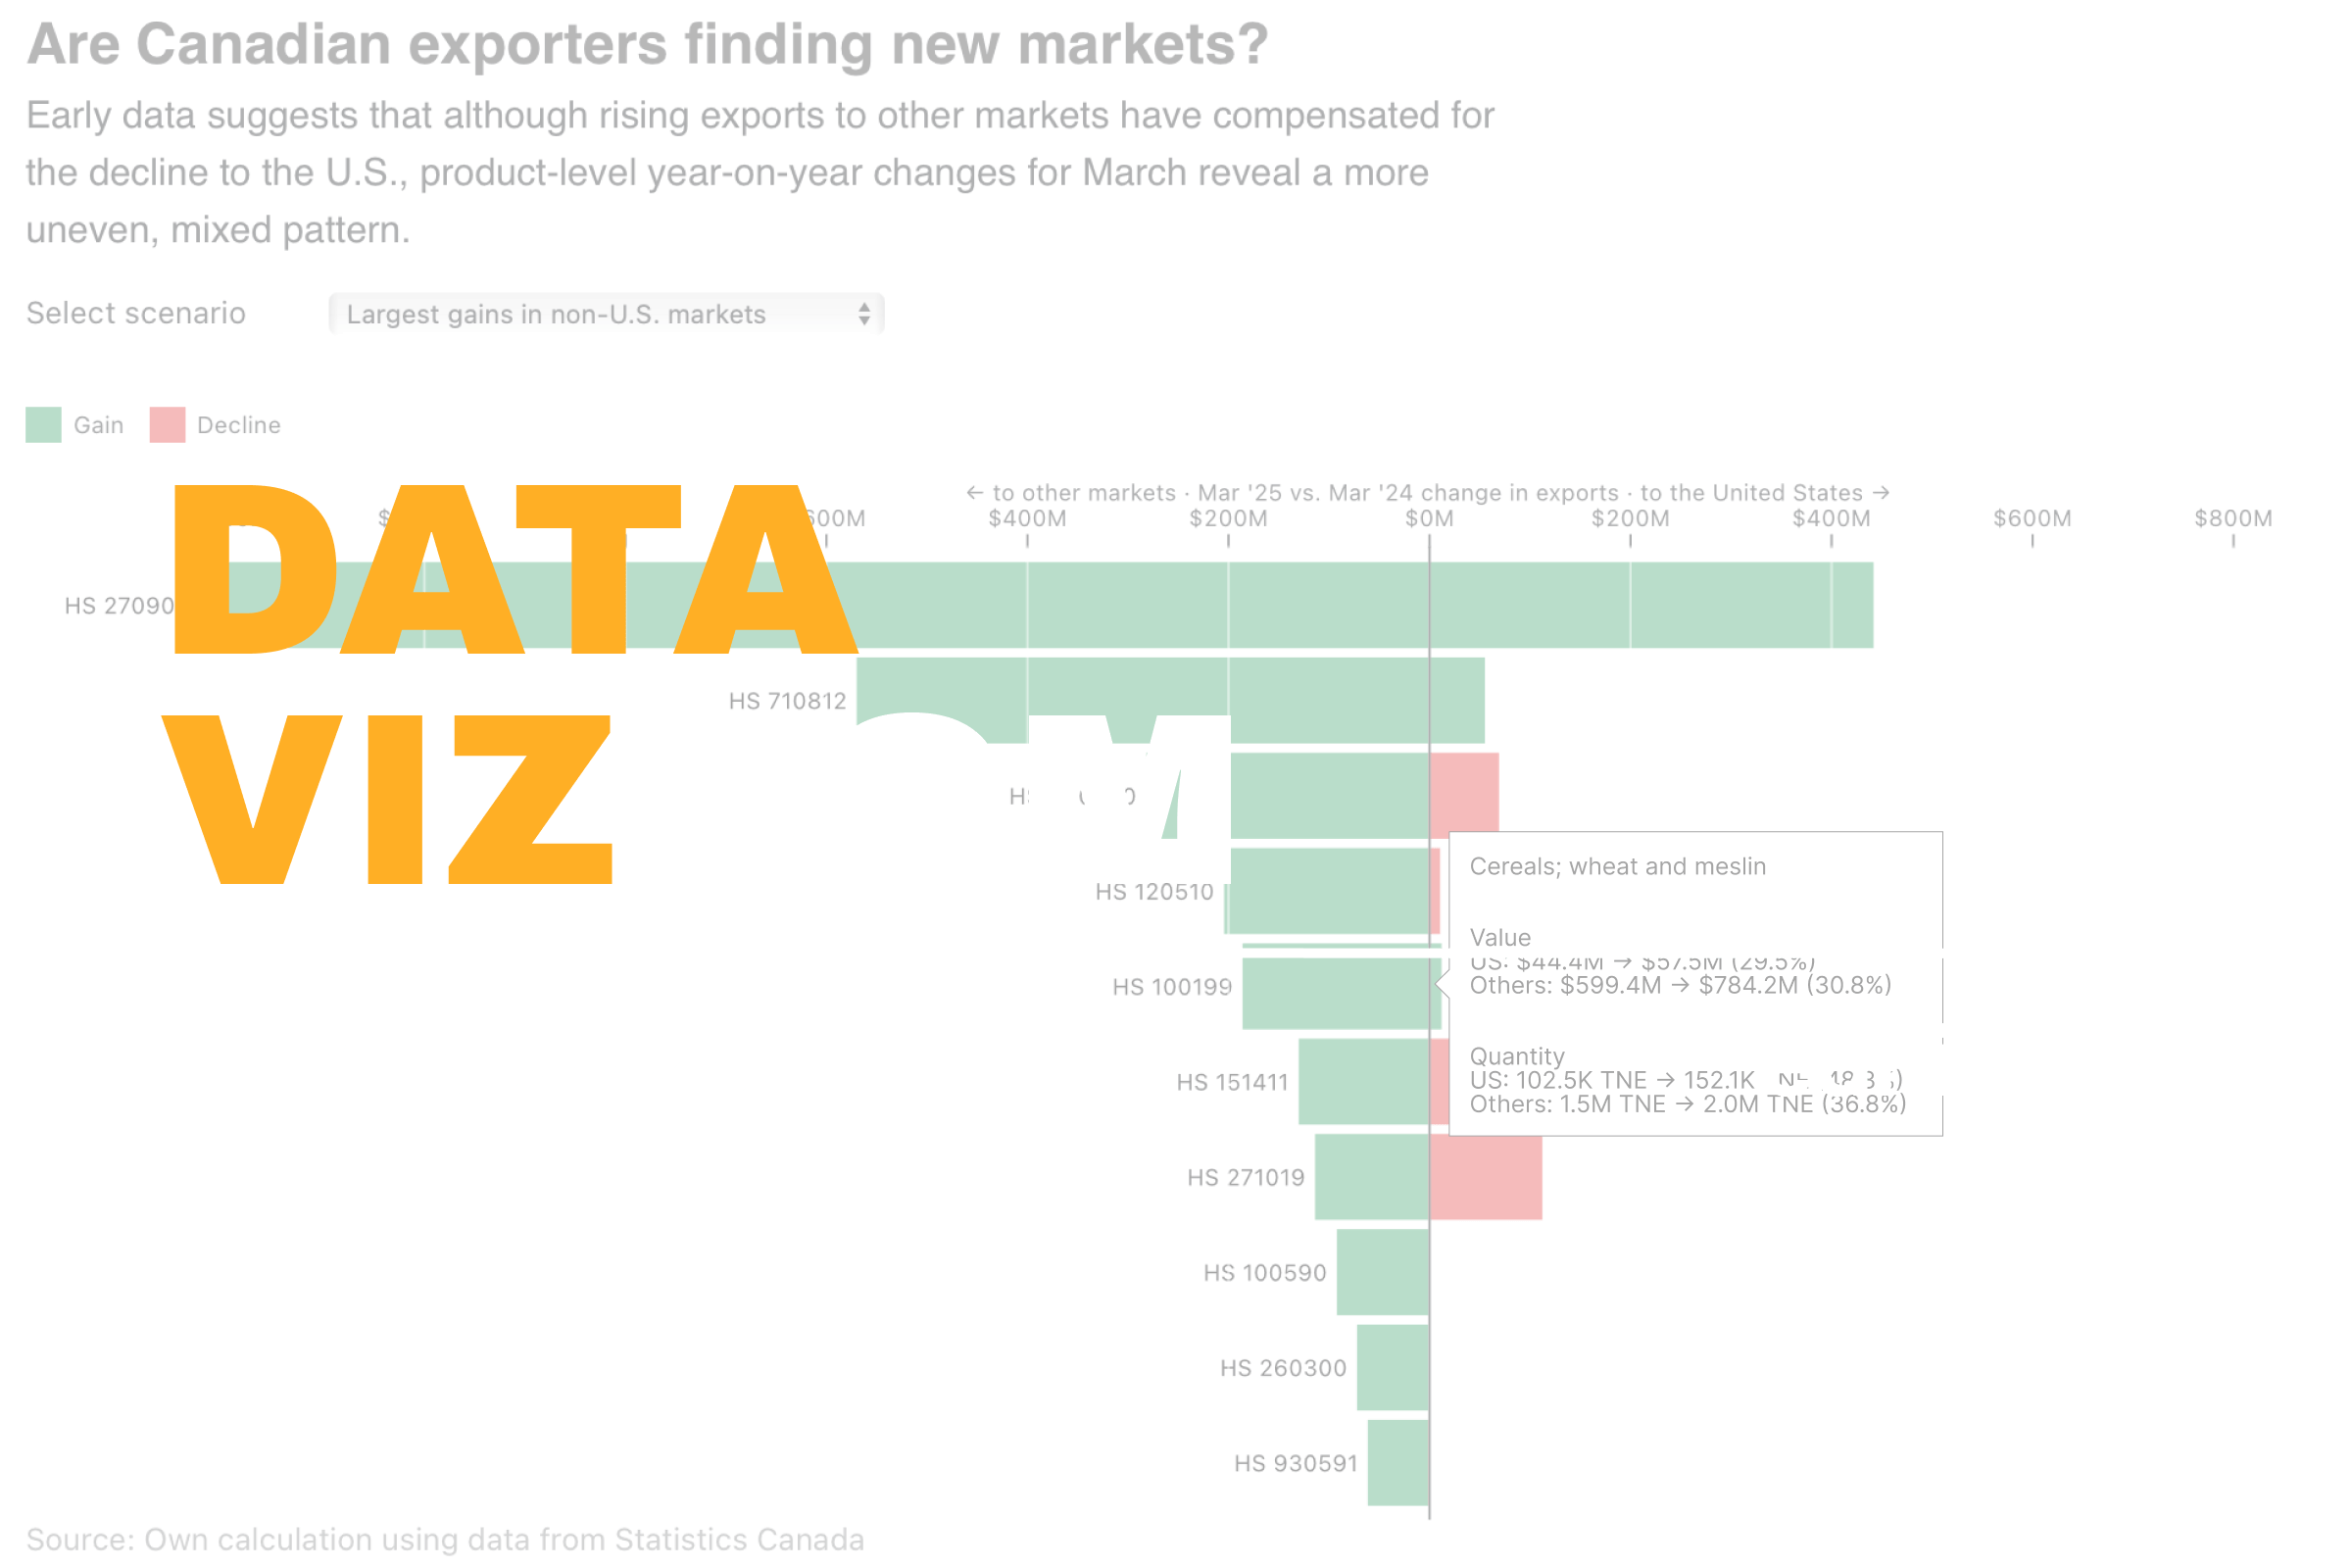
Filtering for products with the largest absolute gains in non-U.S. markets, we find that most were already skewed toward international demand, with two major exceptions: crude oil and petroleum. These two categories saw explosive growth, surging by 650% and 40% respectively, reaching $1.4 billion and $400 million in non-U.S. markets compared to March 2024. Hovering over the chart also reveals that these value increases reflect not just price effects but higher traded volumes.
Switching to products with the largest declines in U.S. sales, only four show compensating gains in other markets. Of these, only petroleum, vegetable oils, and airplanes recorded gains large enough to fully offset their U.S. losses. Filtering specifically for products where declines in the U.S. were offset by increases elsewhere produces a similar list of products. Finally, an examination of the top exports for March 2025 shows growth across both U.S. and non-U.S. markets, reflecting the broader year-over-year growth in total exports.
This breakdown underscores that while some Canadian exports have found new markets to absorb U.S. losses, this pattern is far from uniform. Many of the biggest non-U.S. gains were in products that hadn’t seen major U.S. declines at all. As businesses rush deliveries and adjust to the new tariffs, only future data will reveal whether these export shifts signal a lasting market realignment.
What better way to understand concepts big and small than through data visualizations? In this blog series, we explore timely themes in economics and transportation, drawing on data from the SLGL dataHub.