With Aïchata Koné, Jeremy Schneider and Lucien Chaffa
The past few months have revived long-standing concerns about Canada’s alarming trade dependence on the U.S., with renewed calls to expand trade with other countries. Ultimately, it is up to individual firms to identify business opportunities in new markets and offset potential losses from U.S. orders due to rising costs or increasing uncertainty. Yet, it is worth asking: why is Canada’s trade so U.S.-focused?
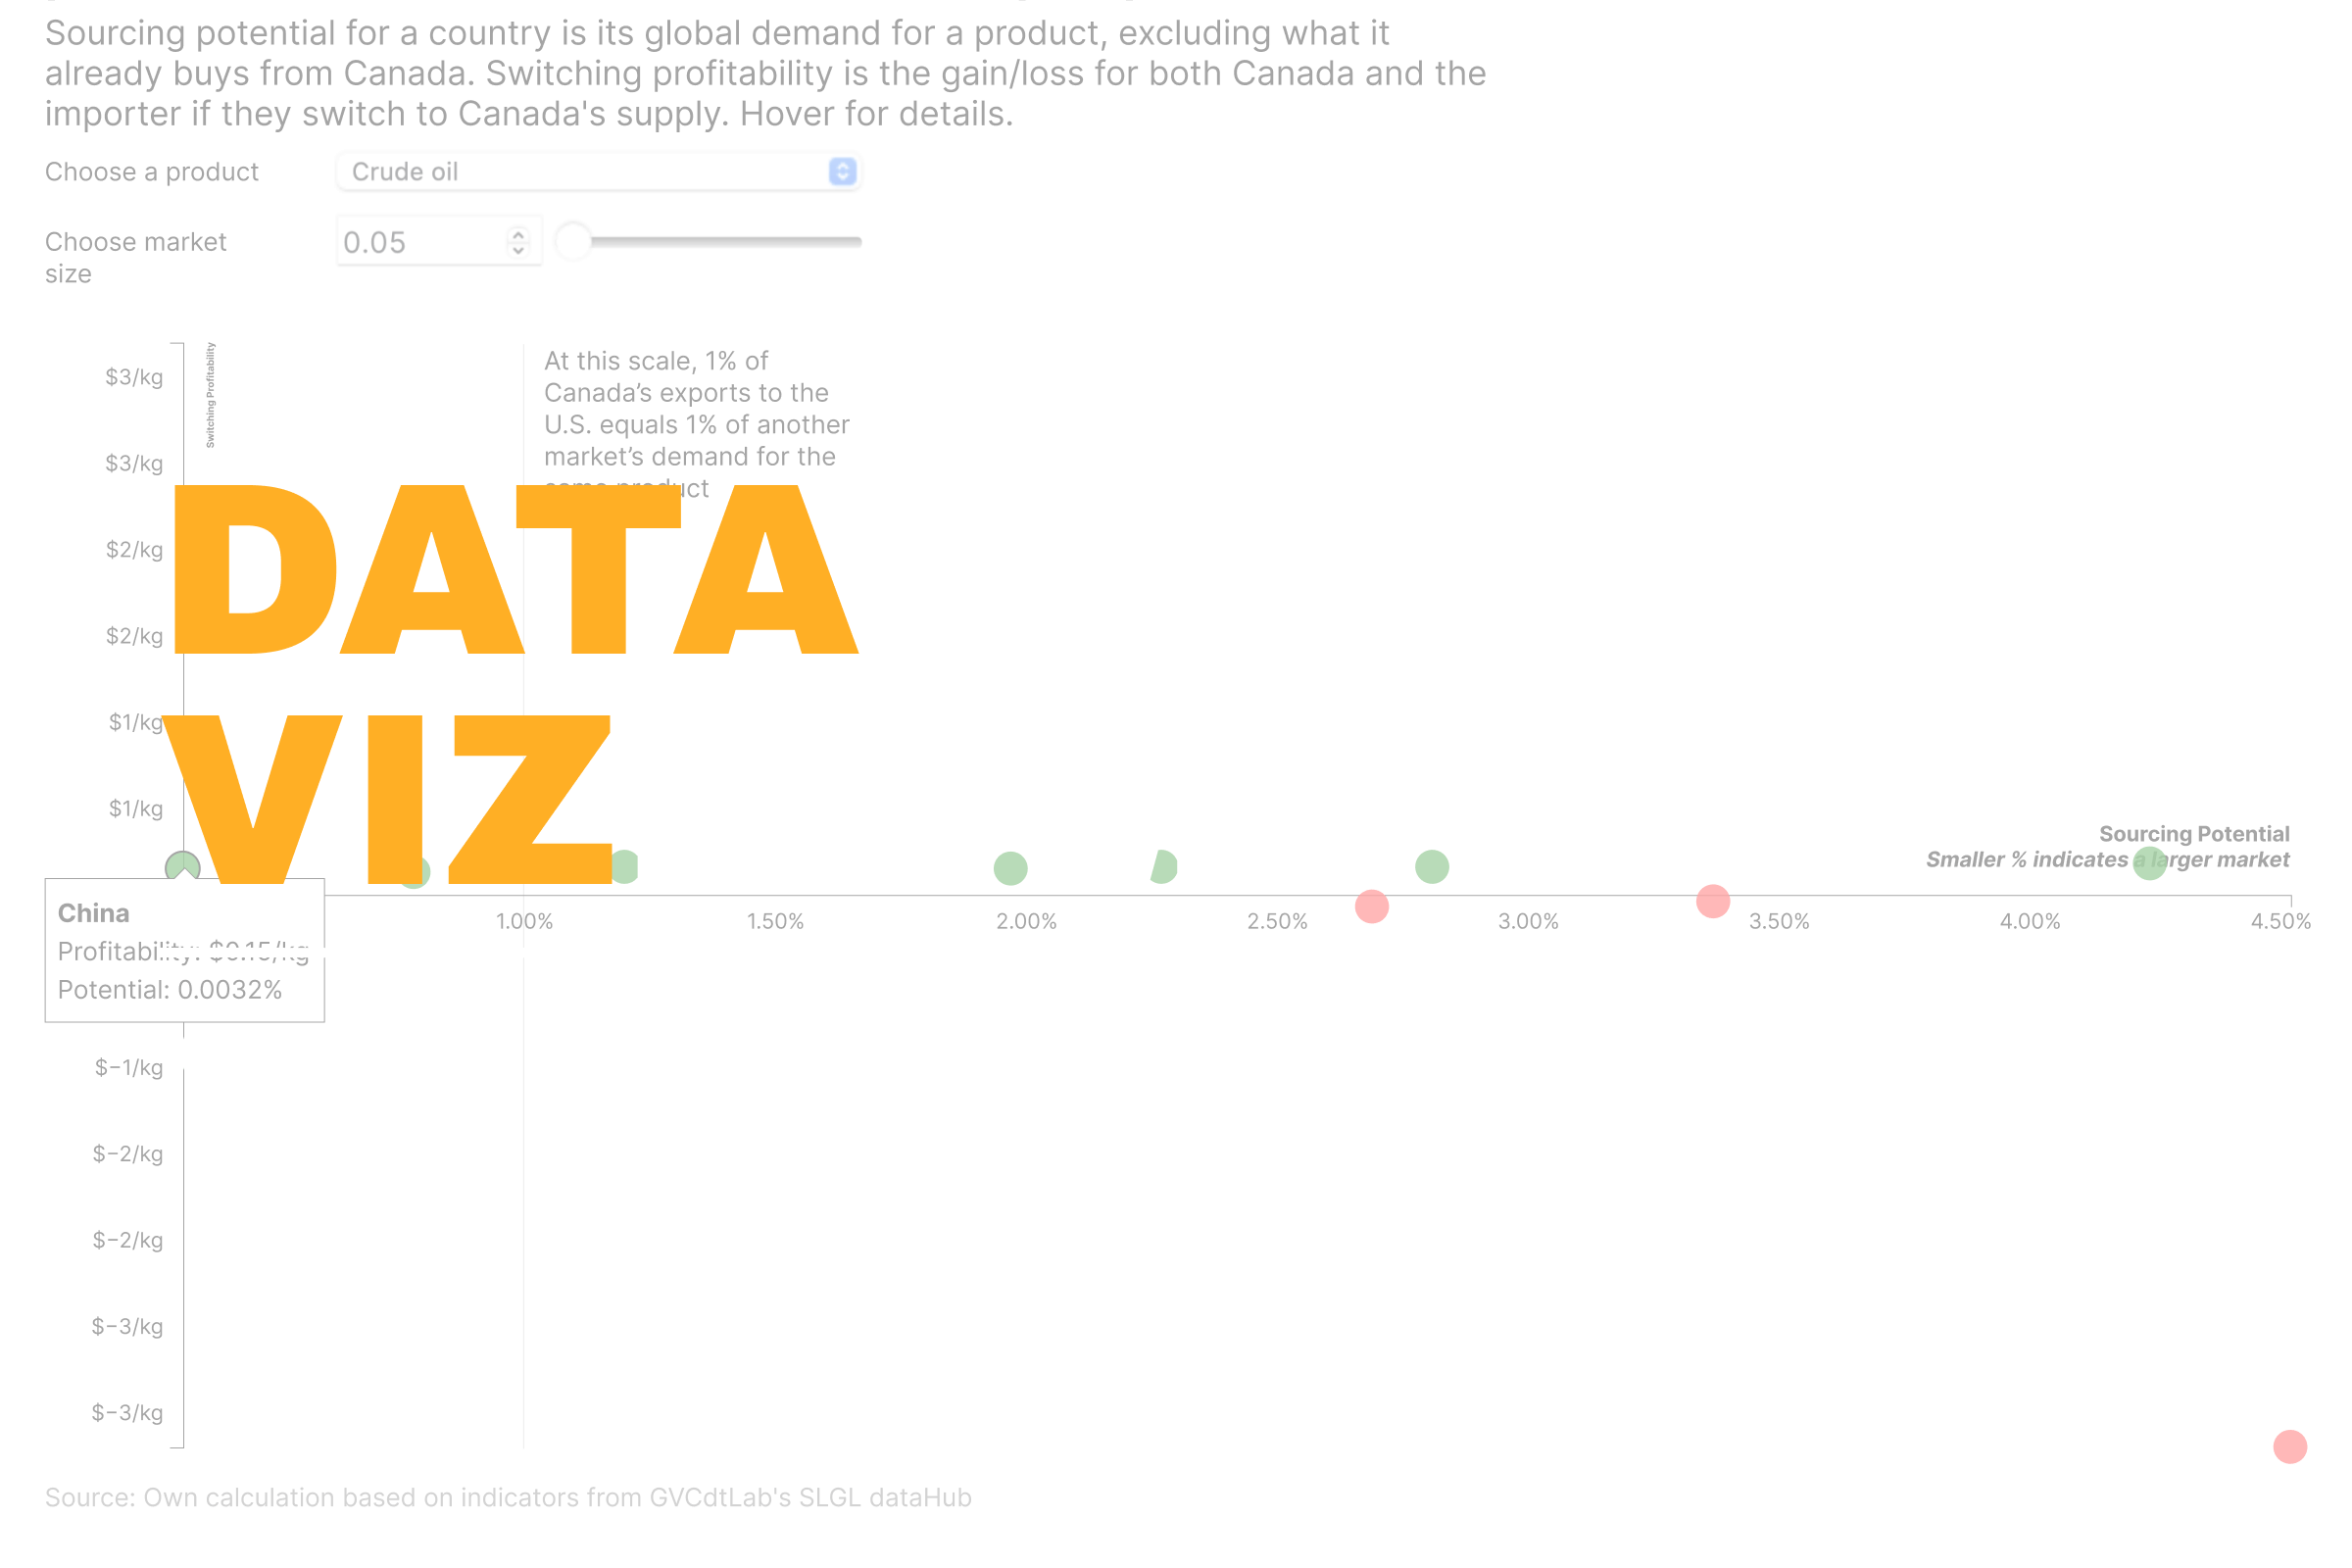
The answer lies in the proximity and price competitiveness of Canadian goods in the North American market, which aligns well with the immense demand generated by the size of the U.S. economy. The visualization below charts the switching profitability and sourcing potential for Canada’s top exports to see if Canadian firms can find meaningfully large and profitable markets beyond the U.S.
Switching profitability compares the product-market-price triad (including transport costs) with Canada’s average export price and factors in how much cheaper it is for the importer to source from Canada instead of current suppliers. It is positive when both Canada and the importer benefit from switching. If switching results in a loss for either party, switching profitability is negative.
Sourcing potential measures a country’s global demand for a product, excluding what it already imports from Canada. It is expressed as a ratio comparing 1% of Canada’s exports to the U.S. with the other country’s total demand. If sourcing potential is 1%, fulfilling 1% of U.S. demand is equal to fulfilling 1% of the other market’s demand. Values below 1% mean the other market is larger than the U.S. and values above 1% mean it’s smaller. For example, a value of 10% means fulfilling 10% of the country’s demand equals just 1% of U.S. demand.
For crude oil, we find that China and India offer profitable opportunities with market sizes larger than what Canada currently exports to the U.S. South Korea, Germany, and the Netherlands are also profitable markets, though with smaller demand. Jet engines and transport vehicles show similar promise, with some markets large enough to match U.S.-level demand. However, it’s important to note that this analysis does not account for differences in product specifications or quality, making it most meaningful for relatively homogenous products. Additionally, market profitability can shift with changes in relative prices.
The visualization shows the difficulty in finding profitable and large enough markets for Canada at an aggregate level. While a handful of opportunities exist for certain products and markets, it is unrealistic to assume that Canada can replicate U.S.-level demand across its major exports. This highlights the need for a realistic diversification strategy that recognizes market limitations and focuses on building depth and resilience where genuine opportunities exist.
The indicators in this article are currently being developed at our lab, building on ongoing research by Adam Touré, Martin Trépanier, and Thierry Warin.
What better way to understand concepts big and small than through data visualizations? In this blog series, we explore timely themes in economics and transportation, drawing on data from the SLGL dataHub.