What better way to understand concepts big and small than through data visualizations? In this blog series, we produce insightful visuals using data from the SLGL dataHub to provide commentary on themes related to economics and transportation. Follow us as we explore and engage with interesting ideas.
With Lucien Chaffa
As Canadian firms seek to manage their exposure to US-imposed tariffs and diversify trade to other markets, a critical factor in any significant trade diversion is ensuring that Canada’s transportation infrastructure can handle the increased volume of goods. In 2024, 75% (US$434 billion) of Canada’s US$568 billion in exports was destined for the US. Thanks to a well-integrated road network, over half of these exports by value were transported by road. With the export of Canadian crude to the US, pipelines accounted for another 25%. The remaining goods were transported by rail, water, and air.
As firms expand to markets beyond the US, traffic at Canadian ports and airports is bound to increase. Road and rail infrastructure will remain essential for moving goods from production sites to these ports. Because commodities require specialized infrastructure and vessels for long-distance transport, significant investments will be necessary if long-term trade dynamics shift. To illustrate this, we examine Canada’s trade with the EU.
In 2024, exports to the 27 EU member states totaled about US$25 billion, or just over 4% of Canada’s total exports. The visualization below presents the modal breakdown of export value by commodity. While volume would be a better indicator of the transportation network’s capacity constraints, the aggregation of goods with different units of measurement makes it impossible to draw meaningful conclusions at a high level.
Description of HS2 commodity codes.
When goods first leave Canada’s borders for export to the EU, ships transport 60% of the total export value, while about 39% is moved by air. The remaining 1% is transported via road, rail, and other modes. Interestingly, this highlights Canada’s relatively low dependence on foreign logistics infrastructure for exports to the EU.
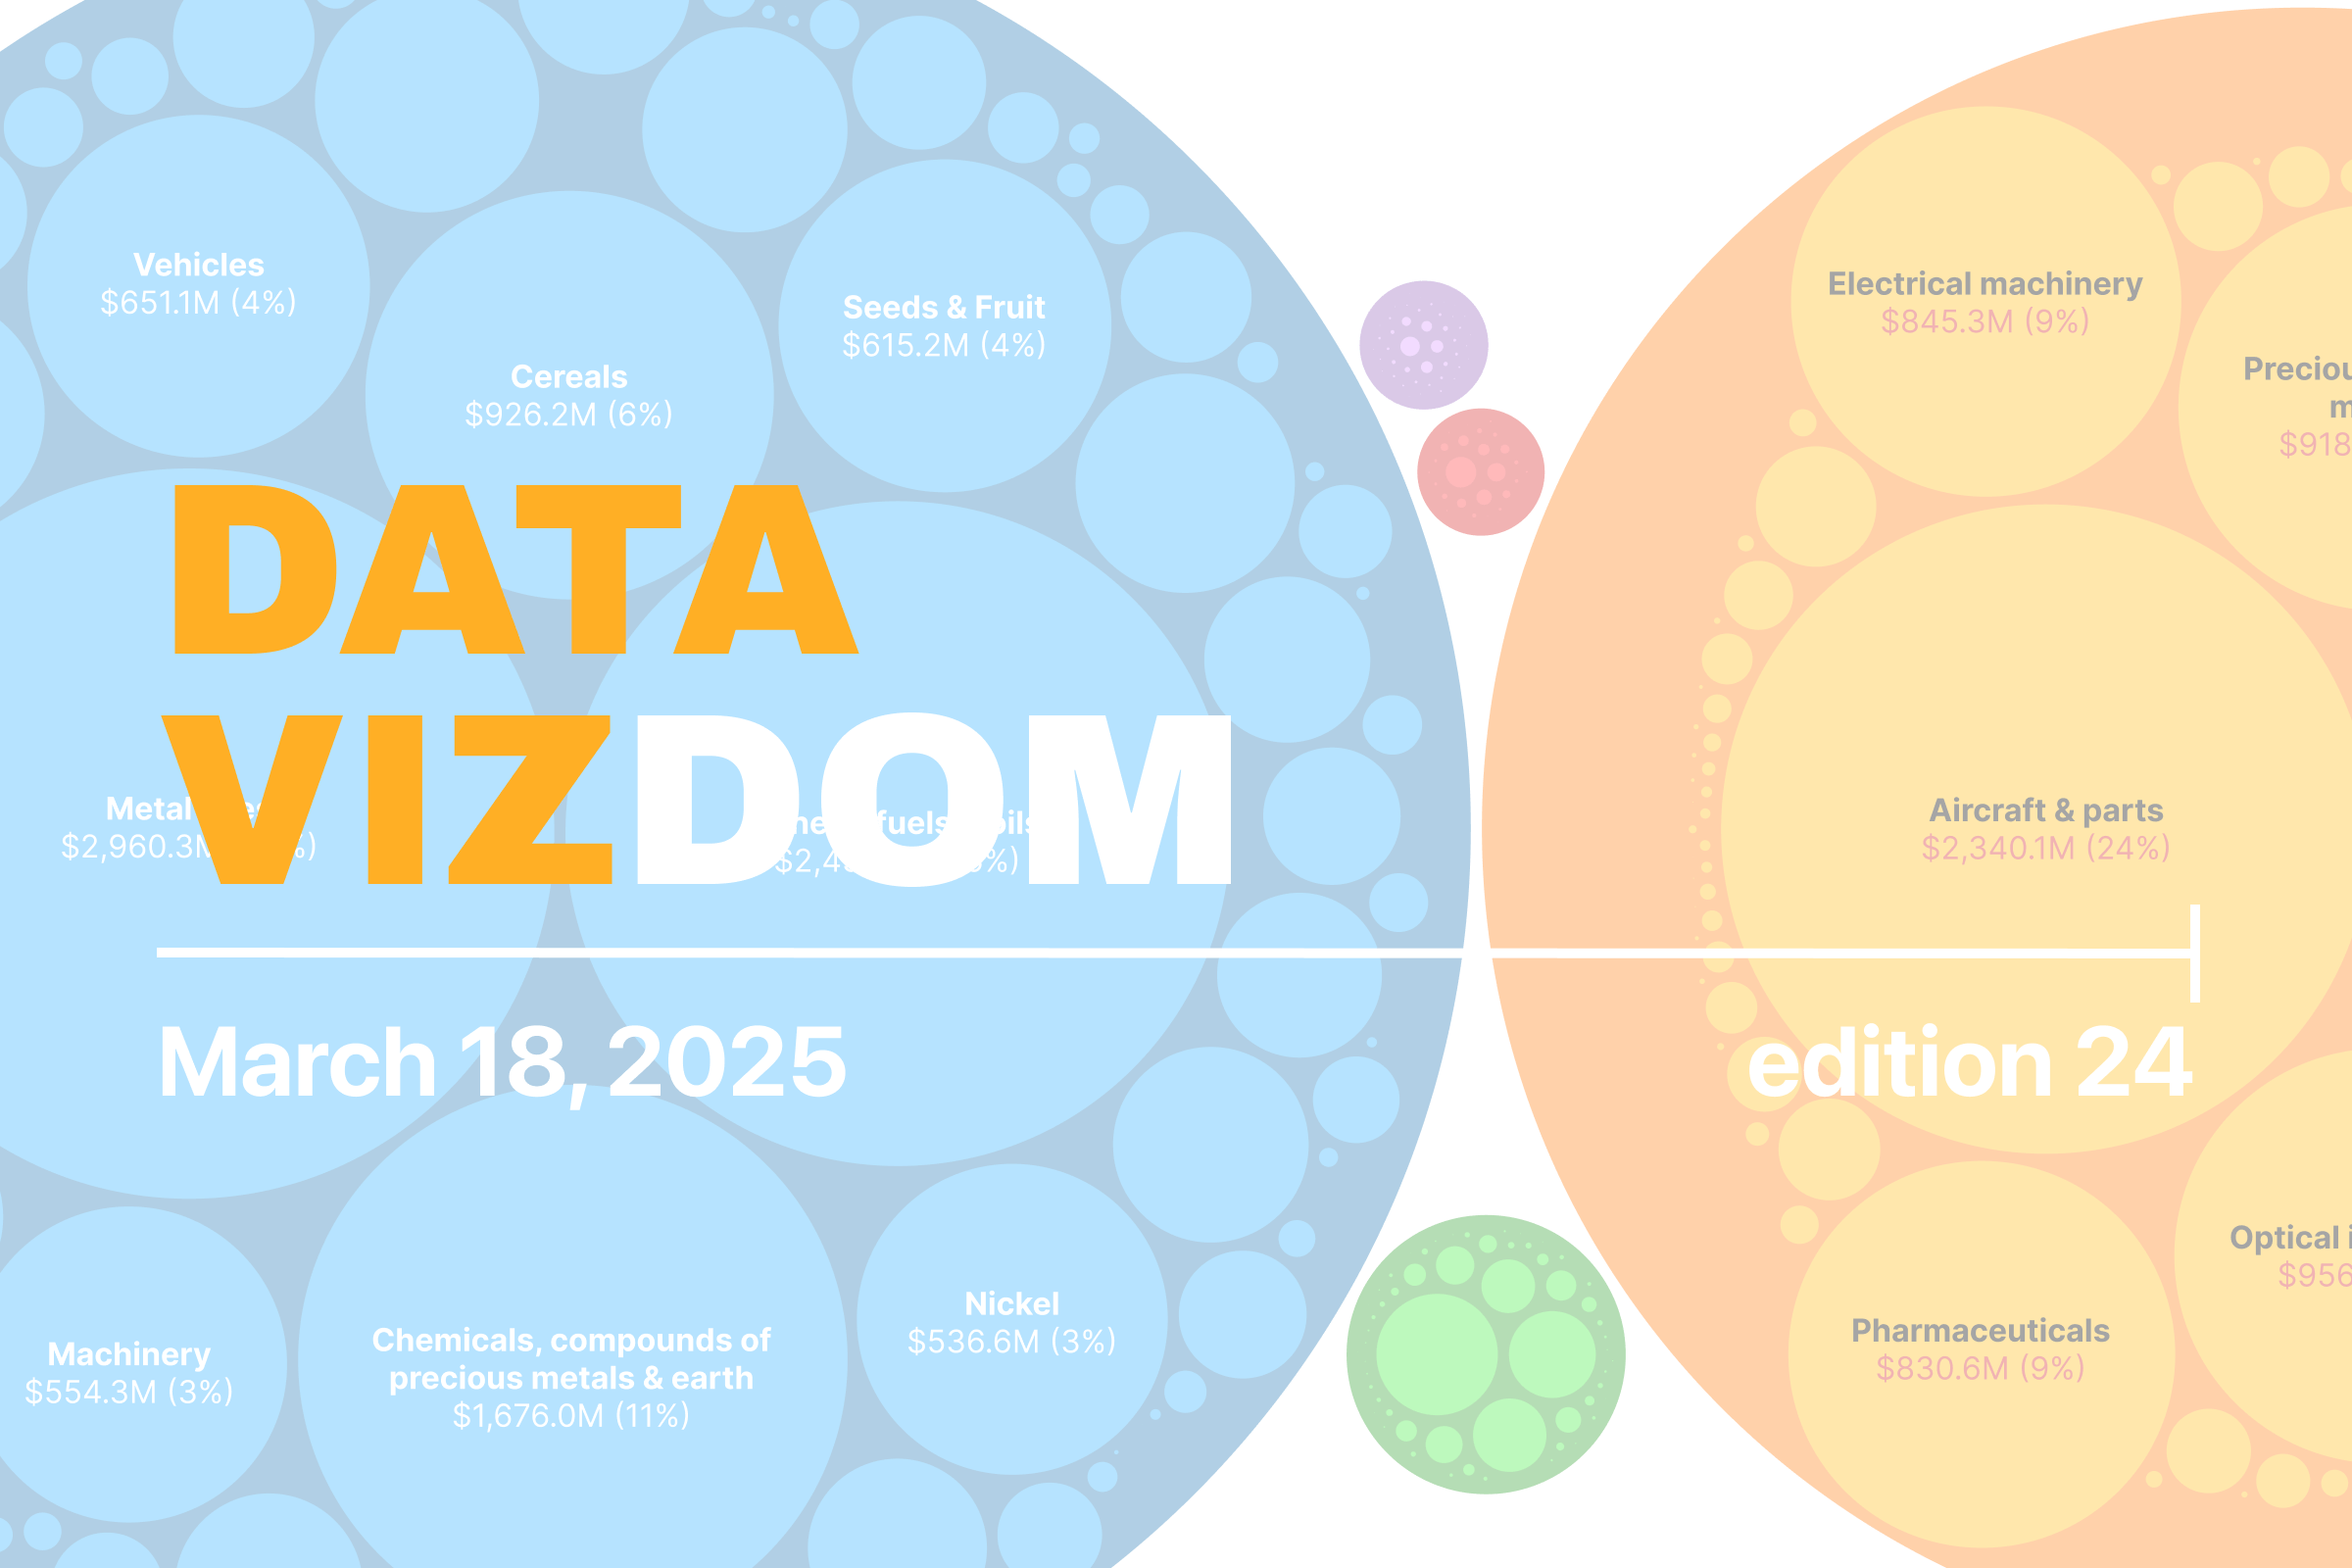
Within each mode, a small handful of commodities dominate the flows. Among goods transported by water, key commodity groups include metal ores (20%), mineral fuels and oils (16%), chemicals and compounds of precious metals and earth (11%), cereals (6%), vehicles (4%), seeds and fruit (4%), nickel (3%), and machinery (3%). Similarly, for goods transported by air, the largest categories are aircraft and parts (24%), machinery (22%), optical instruments (9%), precious stones and metals (9%), pharmaceuticals (9%), and electrical machinery (9%).
To conclude, Canada’s export patterns to the EU highlight the dominance of maritime and air transport, with a select few commodities driving trade within each mode. While Canada’s logistics infrastructure currently supports these flows with minimal reliance on foreign networks, any long-term shift in trade dynamics would require strategic investments in transportation capacity to accommodate changing demands.
Help us make this series even better! We would love to hear your thoughts and suggestions on content ideas and other noteworthy visualizations. Write to Bilal Siddika on LinkedIn or via email.