What better way to understand concepts big and small than through data visualizations? In this blog series, we produce insightful visuals using data from the SLGL dataHub to provide commentary on themes related to economics and transportation. Follow us as we explore and engage with interesting ideas.
With Lucien Chaffa
With the implementation of across-the-board tariffs on the largest trading partners of the U.S., global trade dynamics are bound to shift. These tariffs will have a more pronounced impact on industries that rely on imports to secure inputs for production. Not all inputs can be sourced domestically, and even if domestic supplies exist and become competitive, suppliers may not be able to meet increased demand immediately. To better understand how rising input costs affect U.S. industries, we can analyze imports based on their intended use.
Viewed this way, the $3,220 billion in U.S. goods imports in 2024 can be categorized as follows: $1,570 billion for intermediate use, $665 billion for capital formation, and $985 billion for final consumption. This means that about half of all imports are used by U.S. industries for further transformation in their own production. The chart below illustrates the breakdown of intermediate goods imports by type and origin.
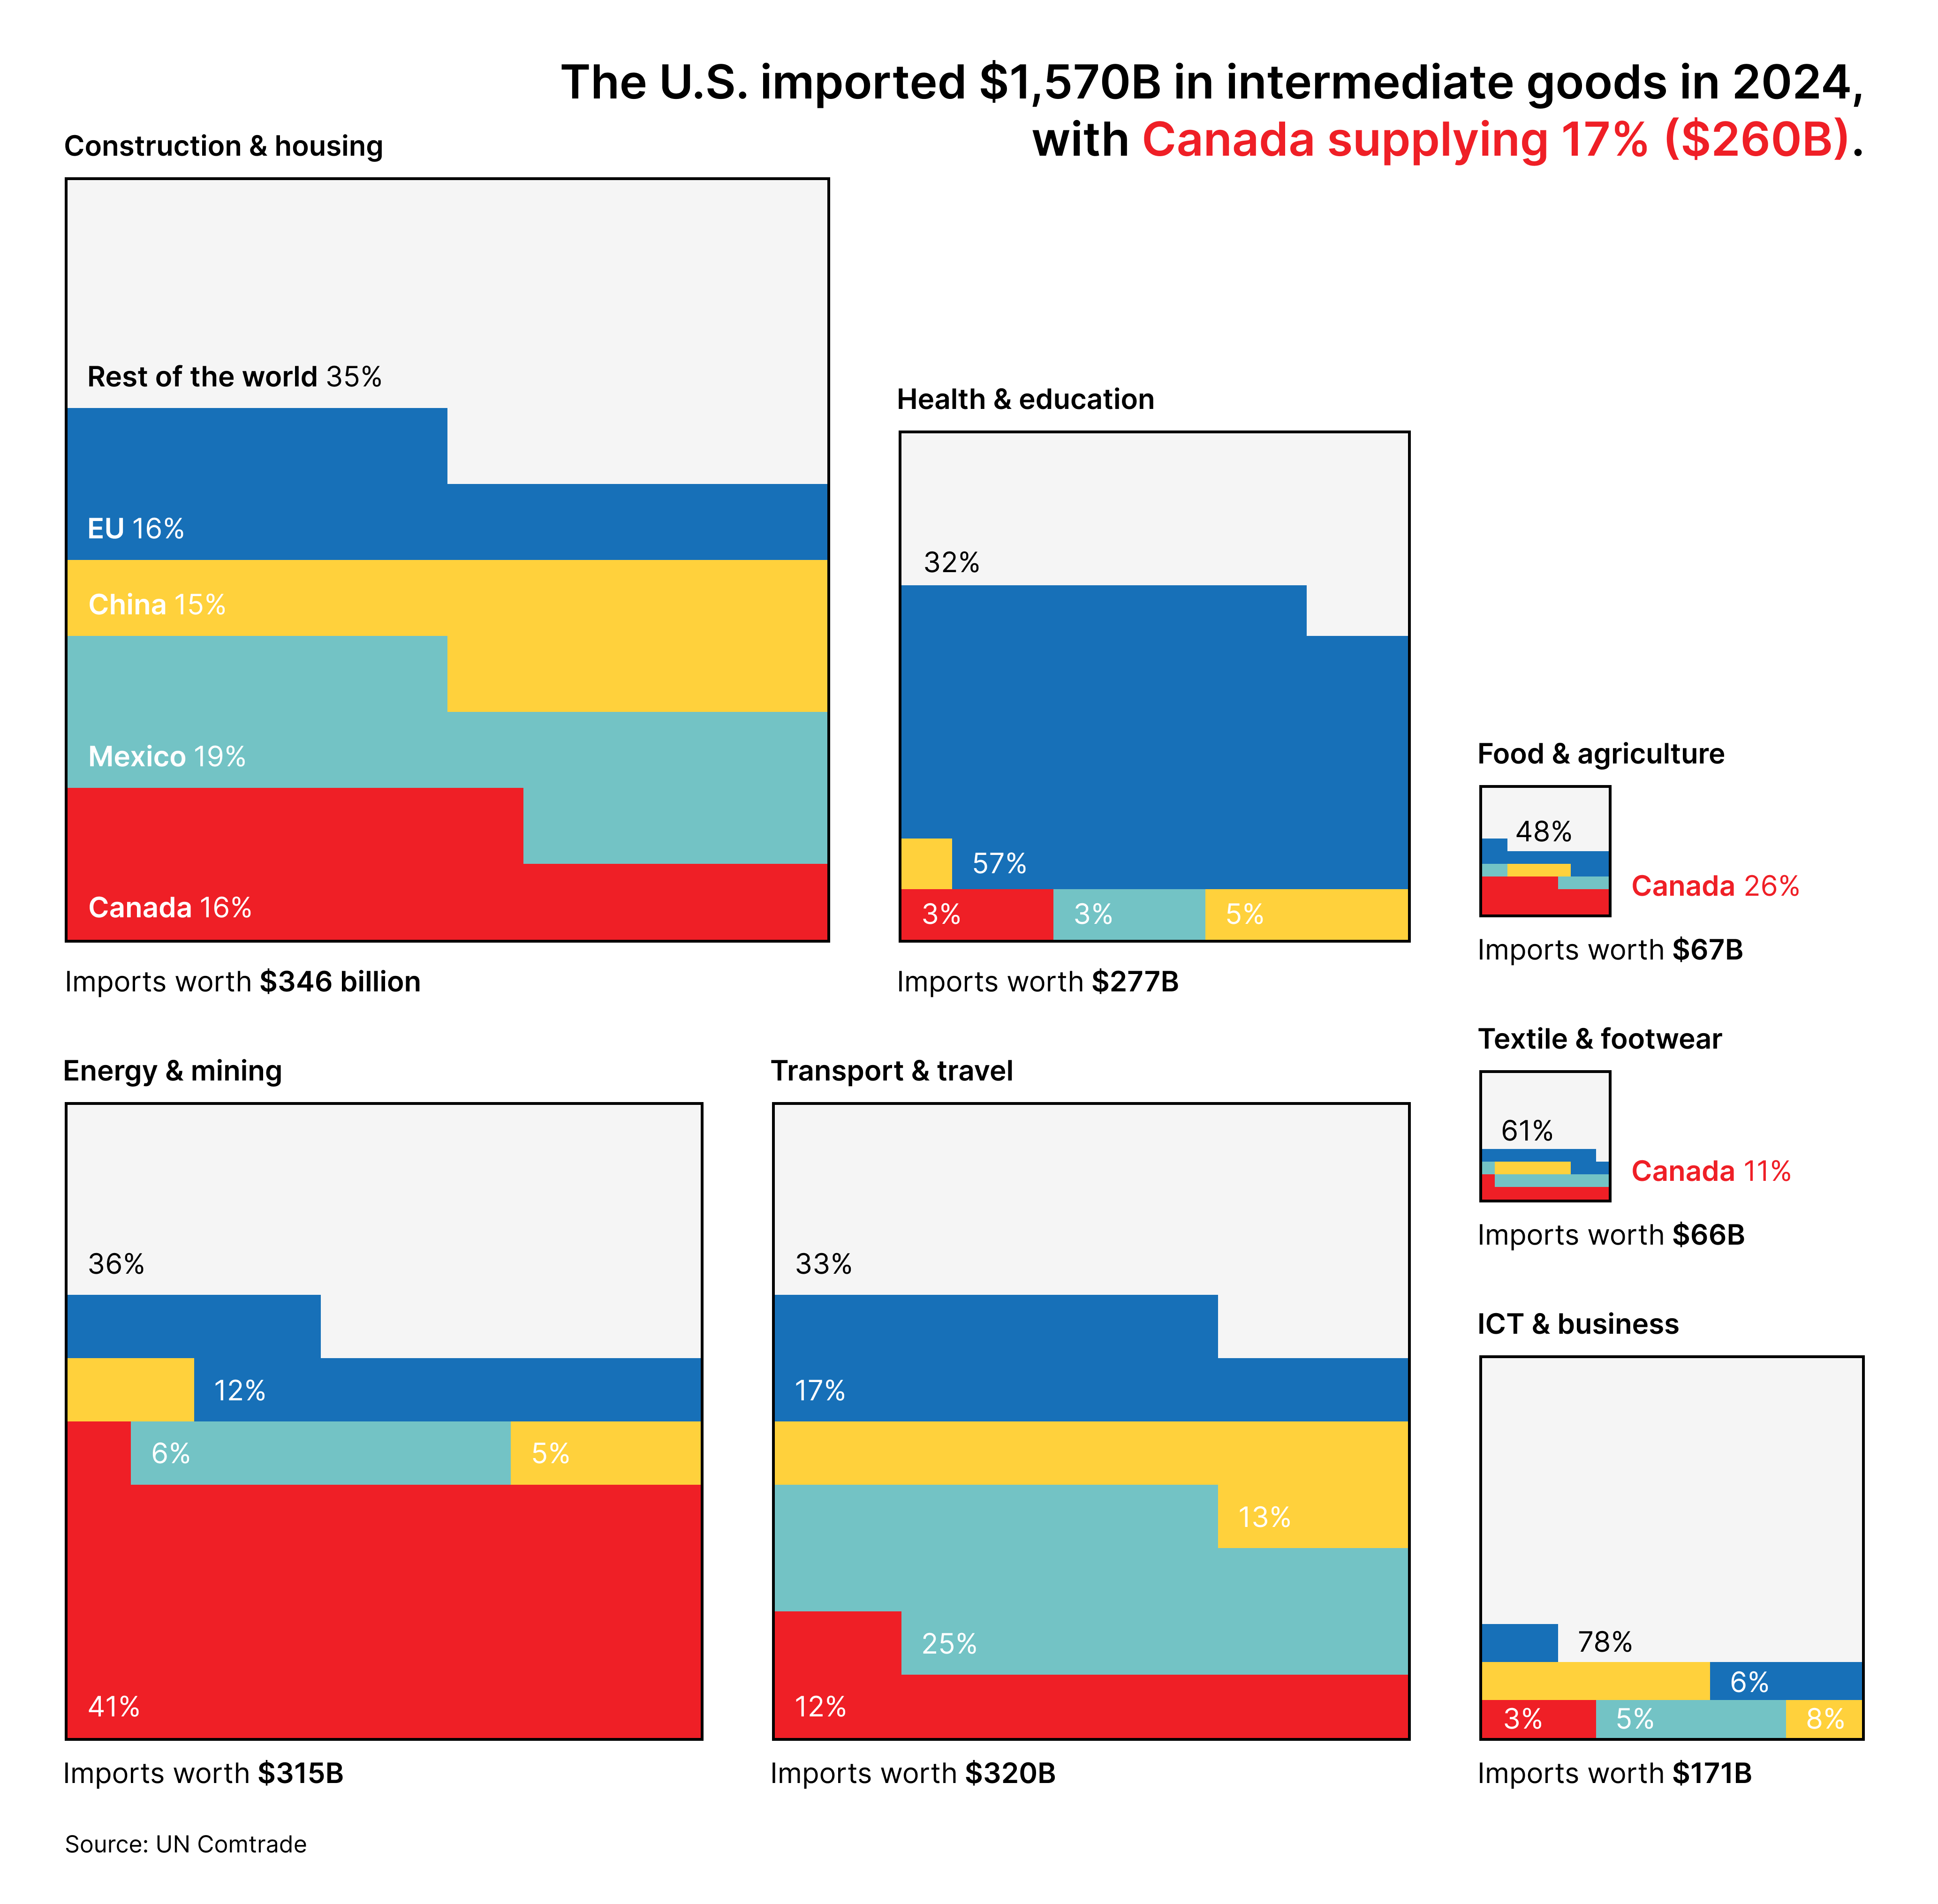
The chart shows that imports from Canada, Mexico, and China account for a significant share of intermediate goods across categories. Canadian firms exported $401 billion worth of goods to the U.S., with a striking 65% classified as intermediate inputs. Reliance on Canadian inputs is particularly high for energy & mining products (41%) and food & agriculture products (26%). While the percentages are relatively lower for other product categories, if supplies from other regions also become more expensive due to tariffs, U.S. industries may have few options other than to pay a premium.
To conclude, this analysis shows that the imposition of tariffs disproportionately affects the import of inputs that U.S. industries rely on. While it is highly likely that the quantity of goods shipped from Canada, Mexico, and China will decline due to higher prices, the overall increase in U.S. production costs will have a cascading effect on the economy and may also reduce the competitiveness of U.S. exports.
This visualization was inspired by Bonnie Berkowitz, Dylan Moriarty and Luis Melgar’s work for The Washington Post.
Help us make this series even better! We would love to hear your thoughts and suggestions on content ideas and other noteworthy visualizations. Write to Bilal Siddika on LinkedIn or via email.