What better way to understand concepts big and small than through data visualizations? In this blog series, we produce insightful visuals using data from the SLGL dataHub to provide commentary on themes related to economics and transportation. Follow us as we explore and engage with interesting ideas.
With Lucien Chaffa
International trade is an important facet of Quebec’s and Ontario’s economy, with industries sourcing inputs, adding value, and exporting outputs through their participation in global supply chains. In 2024, firms in Quebec exported goods worth $121.2 billion, while those in Ontario exported $252.3 billion. This represents about 20% of Quebec’s and 21.5% of Ontario’s provincial GDP, though the export figures may be inflated due to the inclusion of imports embedded in the production of exported commodities.
The reliance on international trade varies across industries due to a host of factors, including the level of integration within global supply chains. For instance, automotive manufacturing in Southern Ontario relies heavily on inputs from across the border in Detroit, in fact inputs can cross the border multiple times before final assembly. Reliance also increases when buyers of a commodity are heavily concentrated in a single market. Of the $11.6 billion in aluminum exports from Quebec, about 93% went to the US.
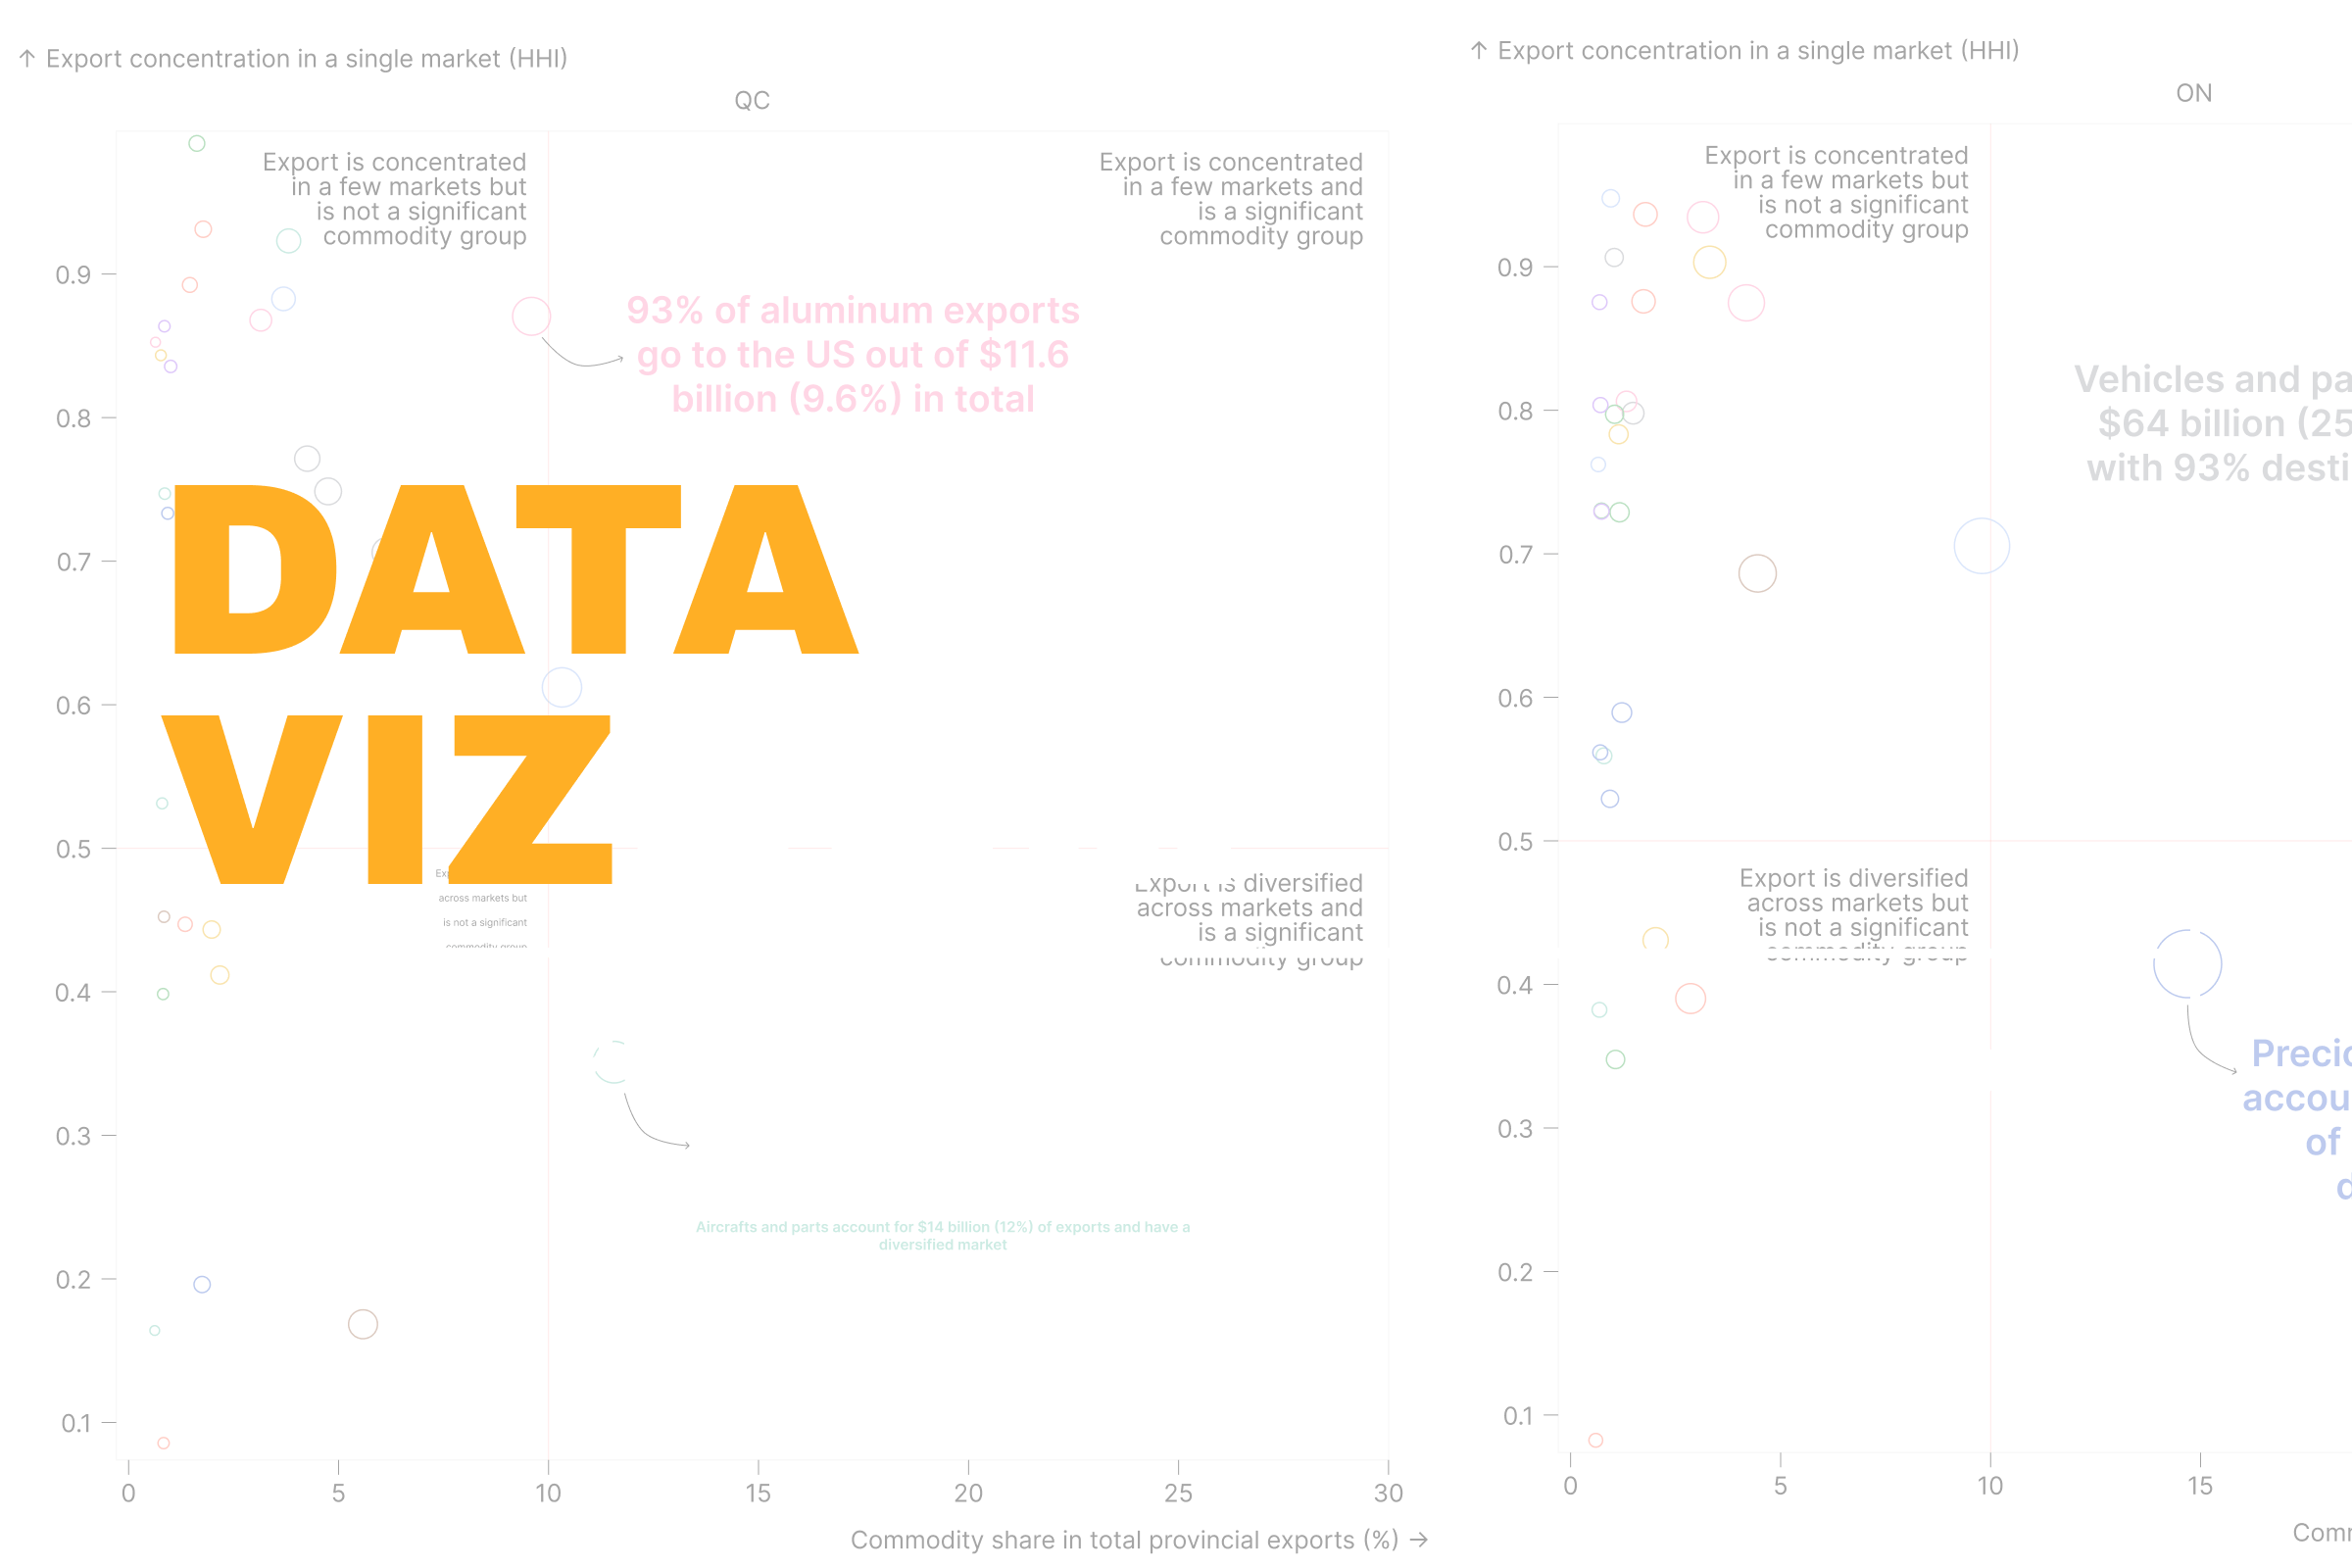
The visualization below shows the diversification of a province’s exports across markets and the relative significance of different commodities. Market diversification is measured using the Herfindahl-Hirschman Index (HHI), where a value of 1 indicates all exports go to a single market, while a value of 0 means exports are evenly distributed across multiple markets. The relative significance of a commodity is measured by its share of the province’s total exports. Since just 30 commodity groups account for over 90% of Quebec’s and Ontario’s international exports, only these are included.
Right away, we see that vehicles and their parts, precious stones and metals, and machinery together make up 50% of Ontario’s exports. Among these, only precious stones and metals have a diversified market, while the other two are heavily reliant on a single export destination. Of the $64.1 billion in vehicles and parts exports, over 93% went to the US and 2.4% to Mexico.
In contrast, Quebec’s top three export commodities—aircrafts and their parts, machinery, and aluminum—together account for less than 32% of total exports, indicating greater diversification across commodity groups. However, only the exports of aircrafts and parts are well diversified across markets. As noted earlier, over 93% of aluminum exports go to the US, resulting in a high HHI of 0.9.
Finally, the bottom-left quadrant of the visualization reveals that, among the top 30 exports in each province, Quebec has a greater number of commodity groups with a diversified market.
In conclusion, the export patterns of Quebec and Ontario highlight the varying degrees of market diversification and commodity reliance across provinces. While Ontario’s top export commodities are concentrated in a few markets, Quebec’s exports show greater diversity both across markets and commodity groups. Understanding these dynamics is crucial to identify risks and opportunities in cross-border supply chains.
Help us make this series even better! We would love to hear your thoughts and suggestions on content ideas and other noteworthy visualizations. Write to Bilal Siddika on LinkedIn or via email.