What better way to understand concepts big and small than through data visualizations? In this blog series, we produce insightful visuals using data from the SLGL dataHub to provide commentary on themes related to economics and transportation. Follow us as we explore and engage with interesting ideas.
With Lucien Chaffa
In 2024, firms in Canada exported $719 billion worth of commodities globally. Of this, $546 billion—or 76%—was destined for buyers in the US. Despite the large distances to other markets, Canada’s exports also find buyers in Asia and Europe, with the next five largest export markets (China, UK, Japan, Mexico, and South Korea) accounting for an additional 12% of total exports.
A breakdown of exports by commodity reveals that just four product categories represent half of Canada’s total exports, with mineral fuels alone accounting for 27%—or $198 billion. The other three categories—vehicles, machinery, and precious stones and metals—represent the next largest export groups.
It is important to note that this measure of exports can overstate export values, as it does not account for the embedded value of imports in a final product, such as a car, treating it the same as the export of mineral ore mined in Canada.
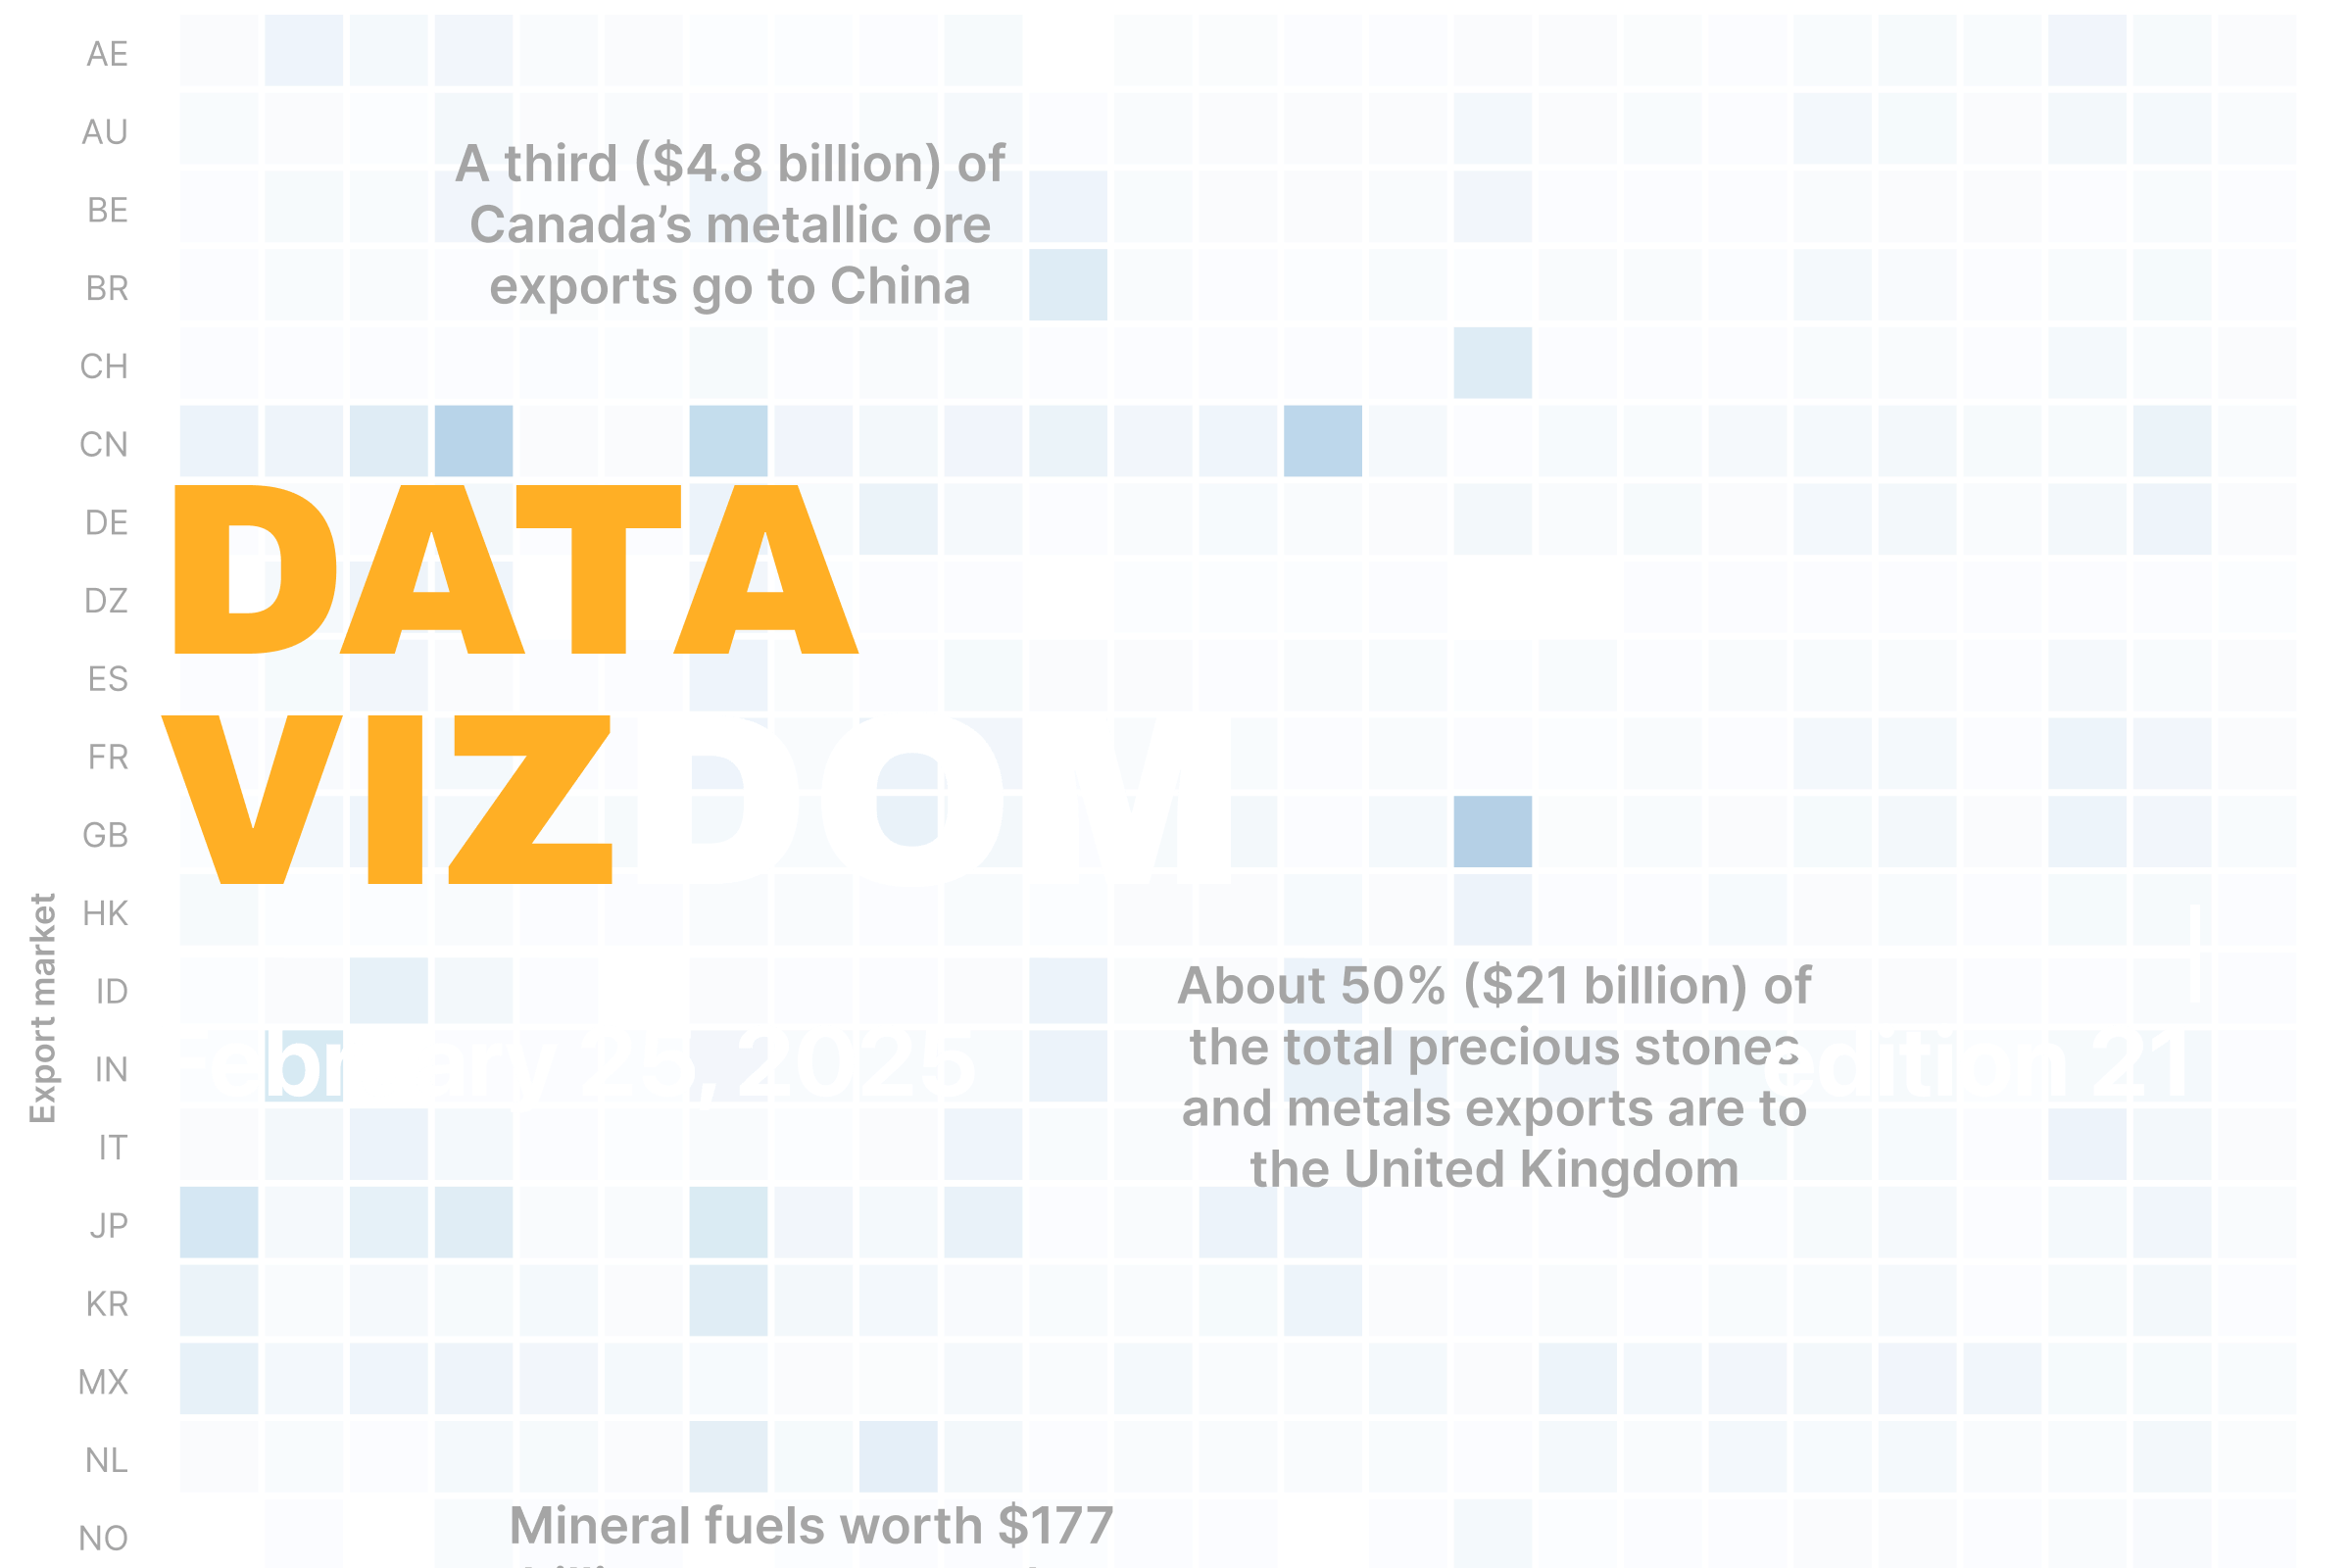
Looking at these commodities and their respective markets provides valuable insights into Canada’s reliance on specific trading partners. The visualization below illustrates the market share for the top 25 commodities by export value, which together account for 86%—or $633 billion—of Canada’s total exports.
Almost 90% of mineral fuel exports were destined for the US, with buyers from China (2.7%), Japan (2%), and South Korea (1.4%) also representing notable markets that could drive future diversification. In contrast, the market for precious stones and metals looks quite different, with the US accounting for only about 28% of exports. Almost half of Canada’s exports in this commodity category went to the UK, with Switzerland accounting for another 12%. China is a major market for three commodity groups—ores, seeds, and wood pulp—each representing more than 30% of the market share.
Overall, these aggregate trade patterns highlight both Canada’s dependence on the US as its primary market and the opportunities for diversification into other regions, particularly in Asia and Europe. By understanding the distribution of exports across commodities and markets, businesses and policymakers can make informed decisions to strengthen Canada’s trade relationships and explore new growth areas in the global market.
Help us make this series even better! We would love to hear your thoughts and suggestions on content ideas and other noteworthy visualizations. Write to Bilal Siddika on LinkedIn or via email.