What better way to understand concepts big and small than through data visualizations? In this blog series, we curate insightful visuals to provide commentary on events, academic theories and themes related to economics and transportation. Join us as we explore and engage with interesting ideas from around the world.
Companies play a crucial role in the global effort to reduce emissions, but a significant portion of their products’ emissions lies outside their direct control, within global supply chains. With rising regulatory pressures, measuring and reducing emissions across these complex networks is becoming a critical challenge. This week’s Data Vizdom explores the issue.
When measured on an end-to-end basis, just eight global supply chains account for over 50% of annual greenhouse gas (GHG) emissions. Notably, only a small fraction is directly attributable to final production, with the majority embedded in upstream and downstream stages of the supply chain.
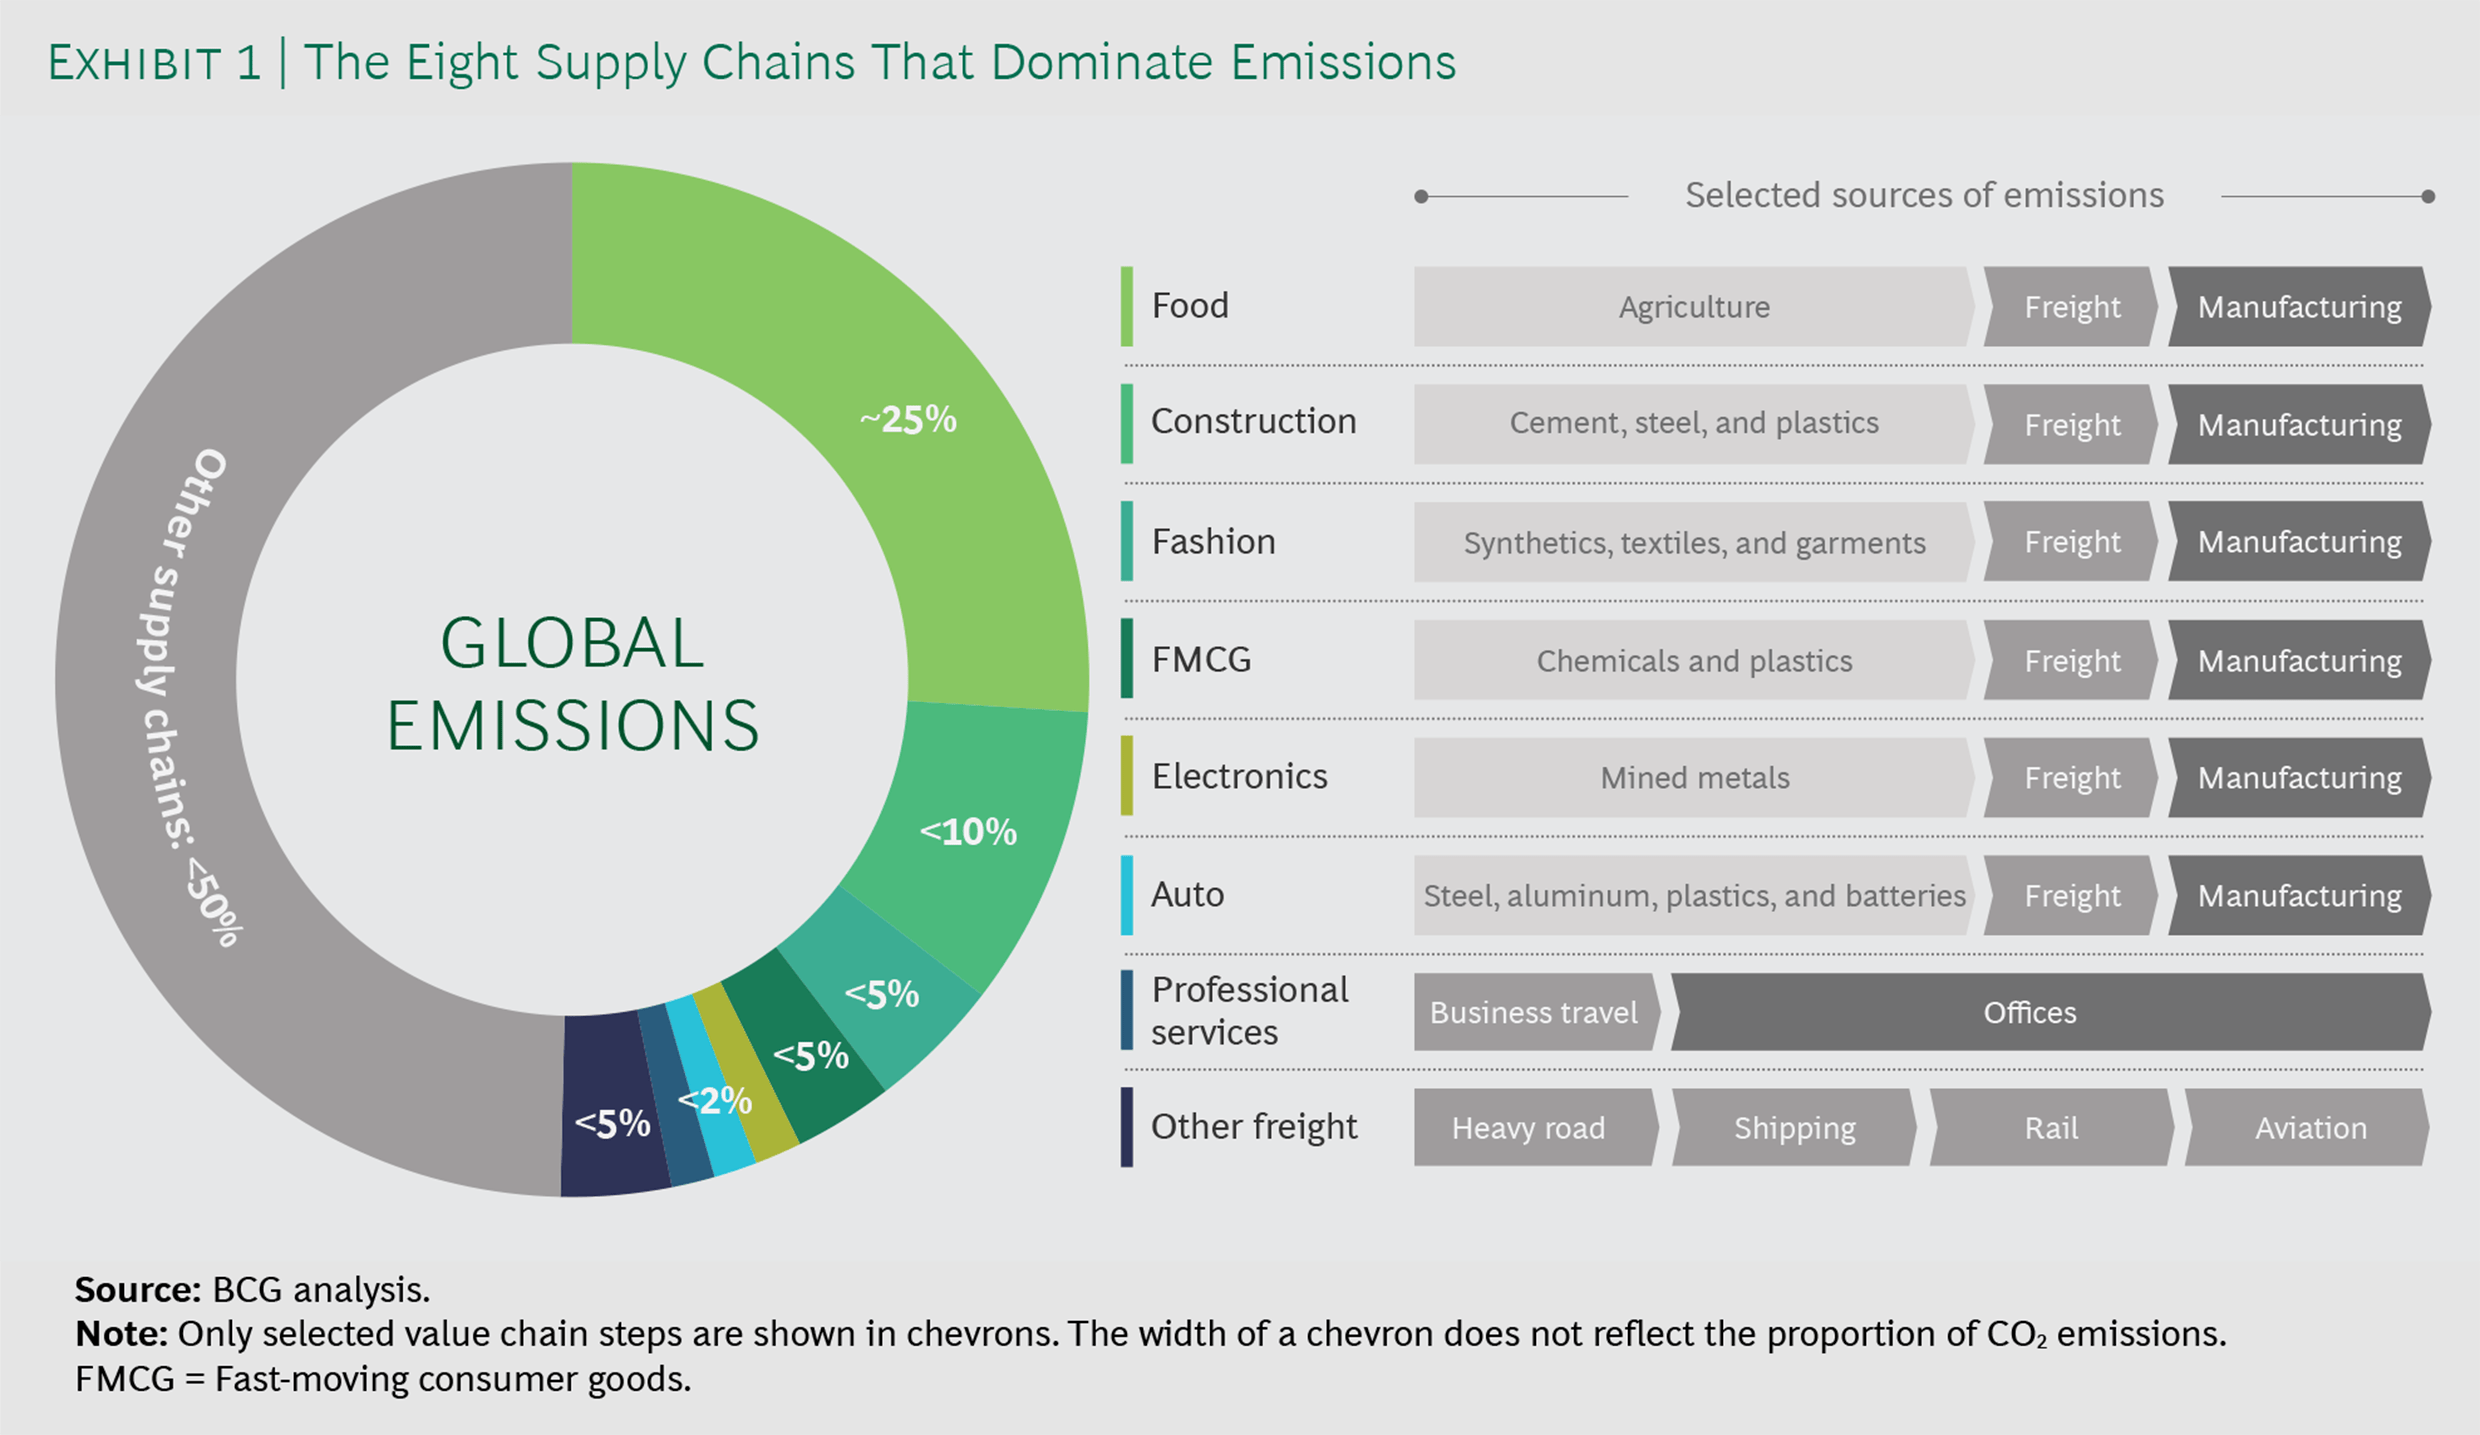
Fight Supply Chain Emissions to Fight Climate Change – Boston Consulting Group (January 26, 2021)
Food production is responsible for a quarter of global emissions, offering a significant opportunity for progress within its supply chain. As the visualization below shows, total GHG emissions per kilogram of food vary widely across products, with the majority attributable to land use changes and farming. While improvements in farming practices are essential, making better food choices can have an immediate impact.
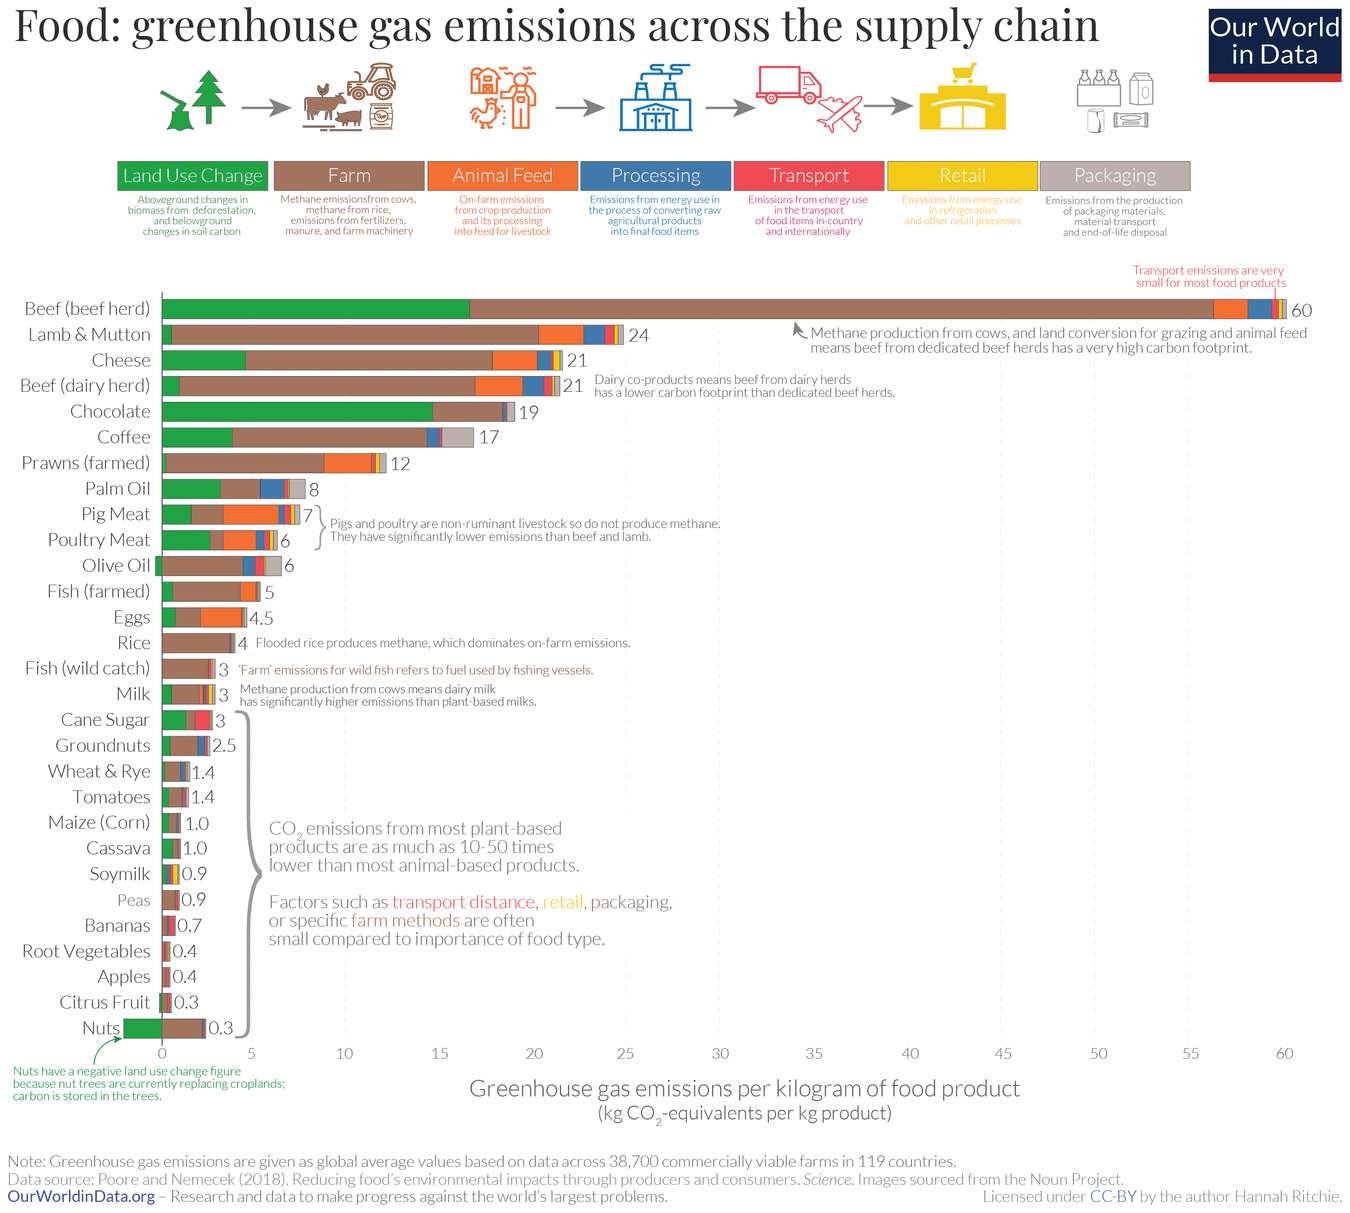
You want to reduce the carbon footprint of your food? Focus on what you eat, not whether your food is local – Our World in Data (January 24, 2020)
This perspective offers revealing insights into the true environmental costs of products. For companies looking to measure emissions in their supply chains, the GHG Protocol categorizes emissions based on their source. Scope 1 refers to direct emissions from a company’s own activities. Scope 2 includes indirect emissions from the energy used in those activities. Finally, Scope 3 encompasses emissions generated across the broader supply chain.
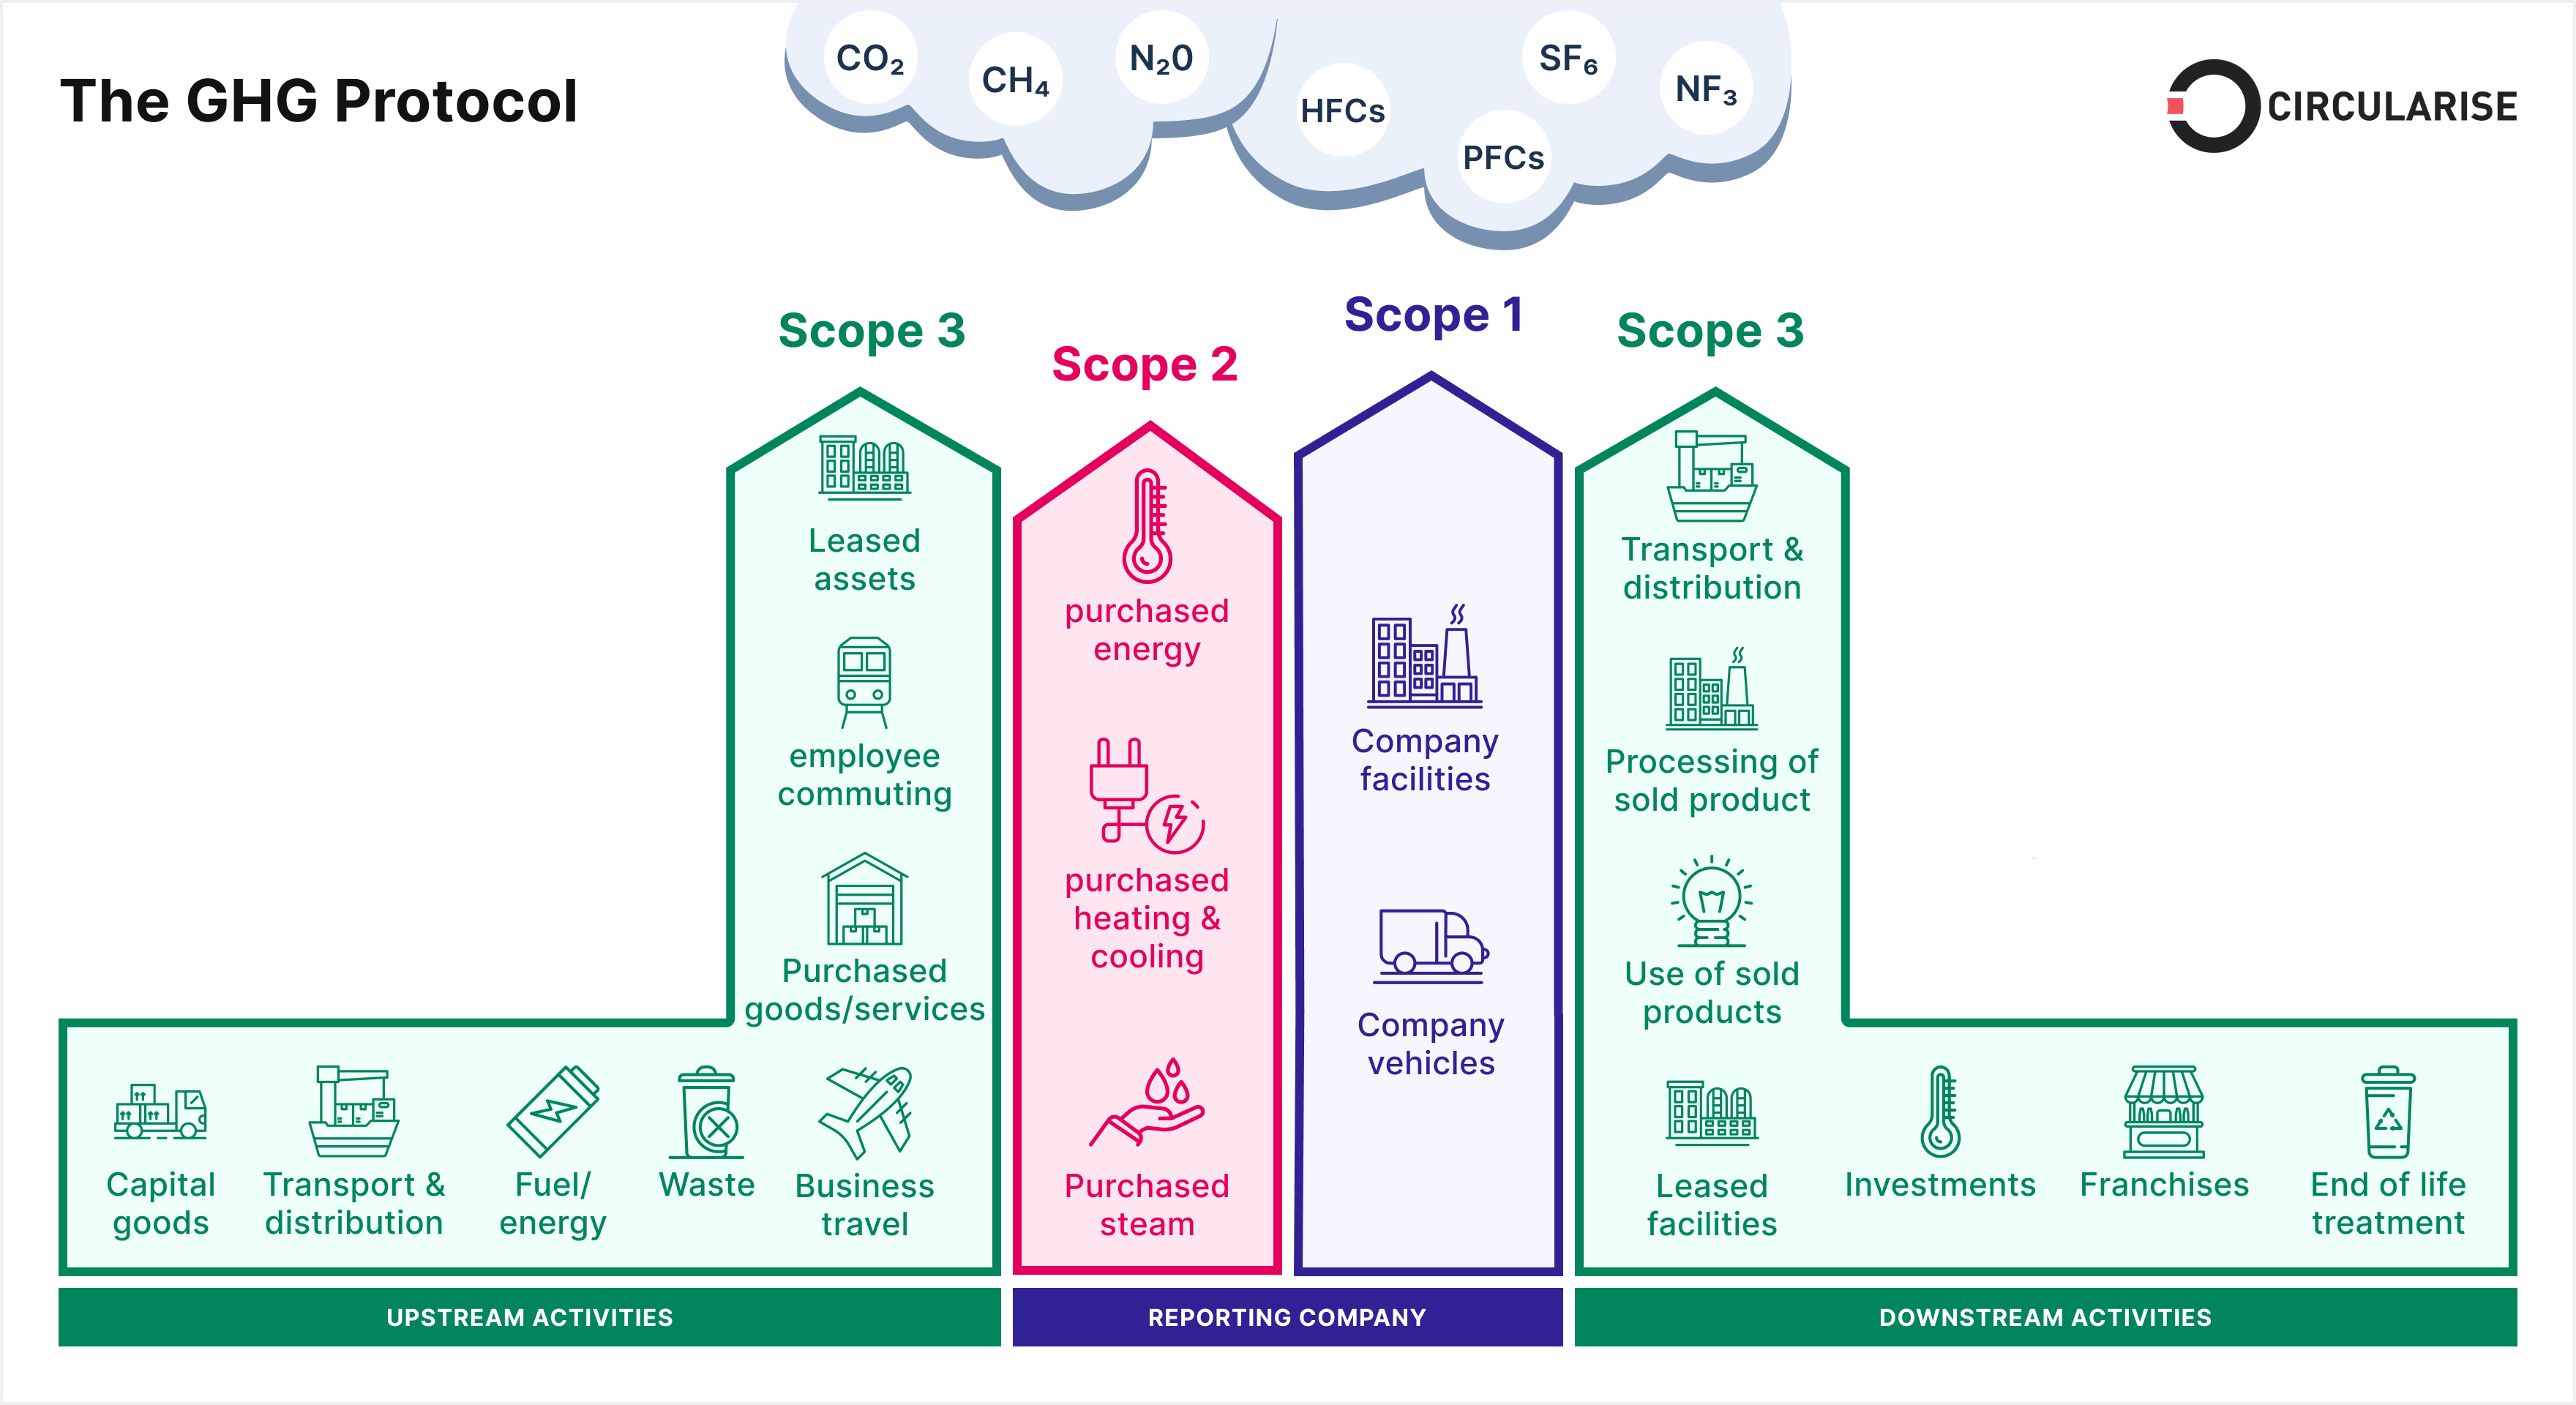
Scope 1, 2, 3 emissions explained – Circularise (November 3, 2022)
When categorized on the basis of the GHG Protocol, it is evident that Scope 3 accounts for, on average, 75% of a company’s emissions. In the chart below, only cement, electricity, steel and transport service industries have shares of Scope 3 below 50%.
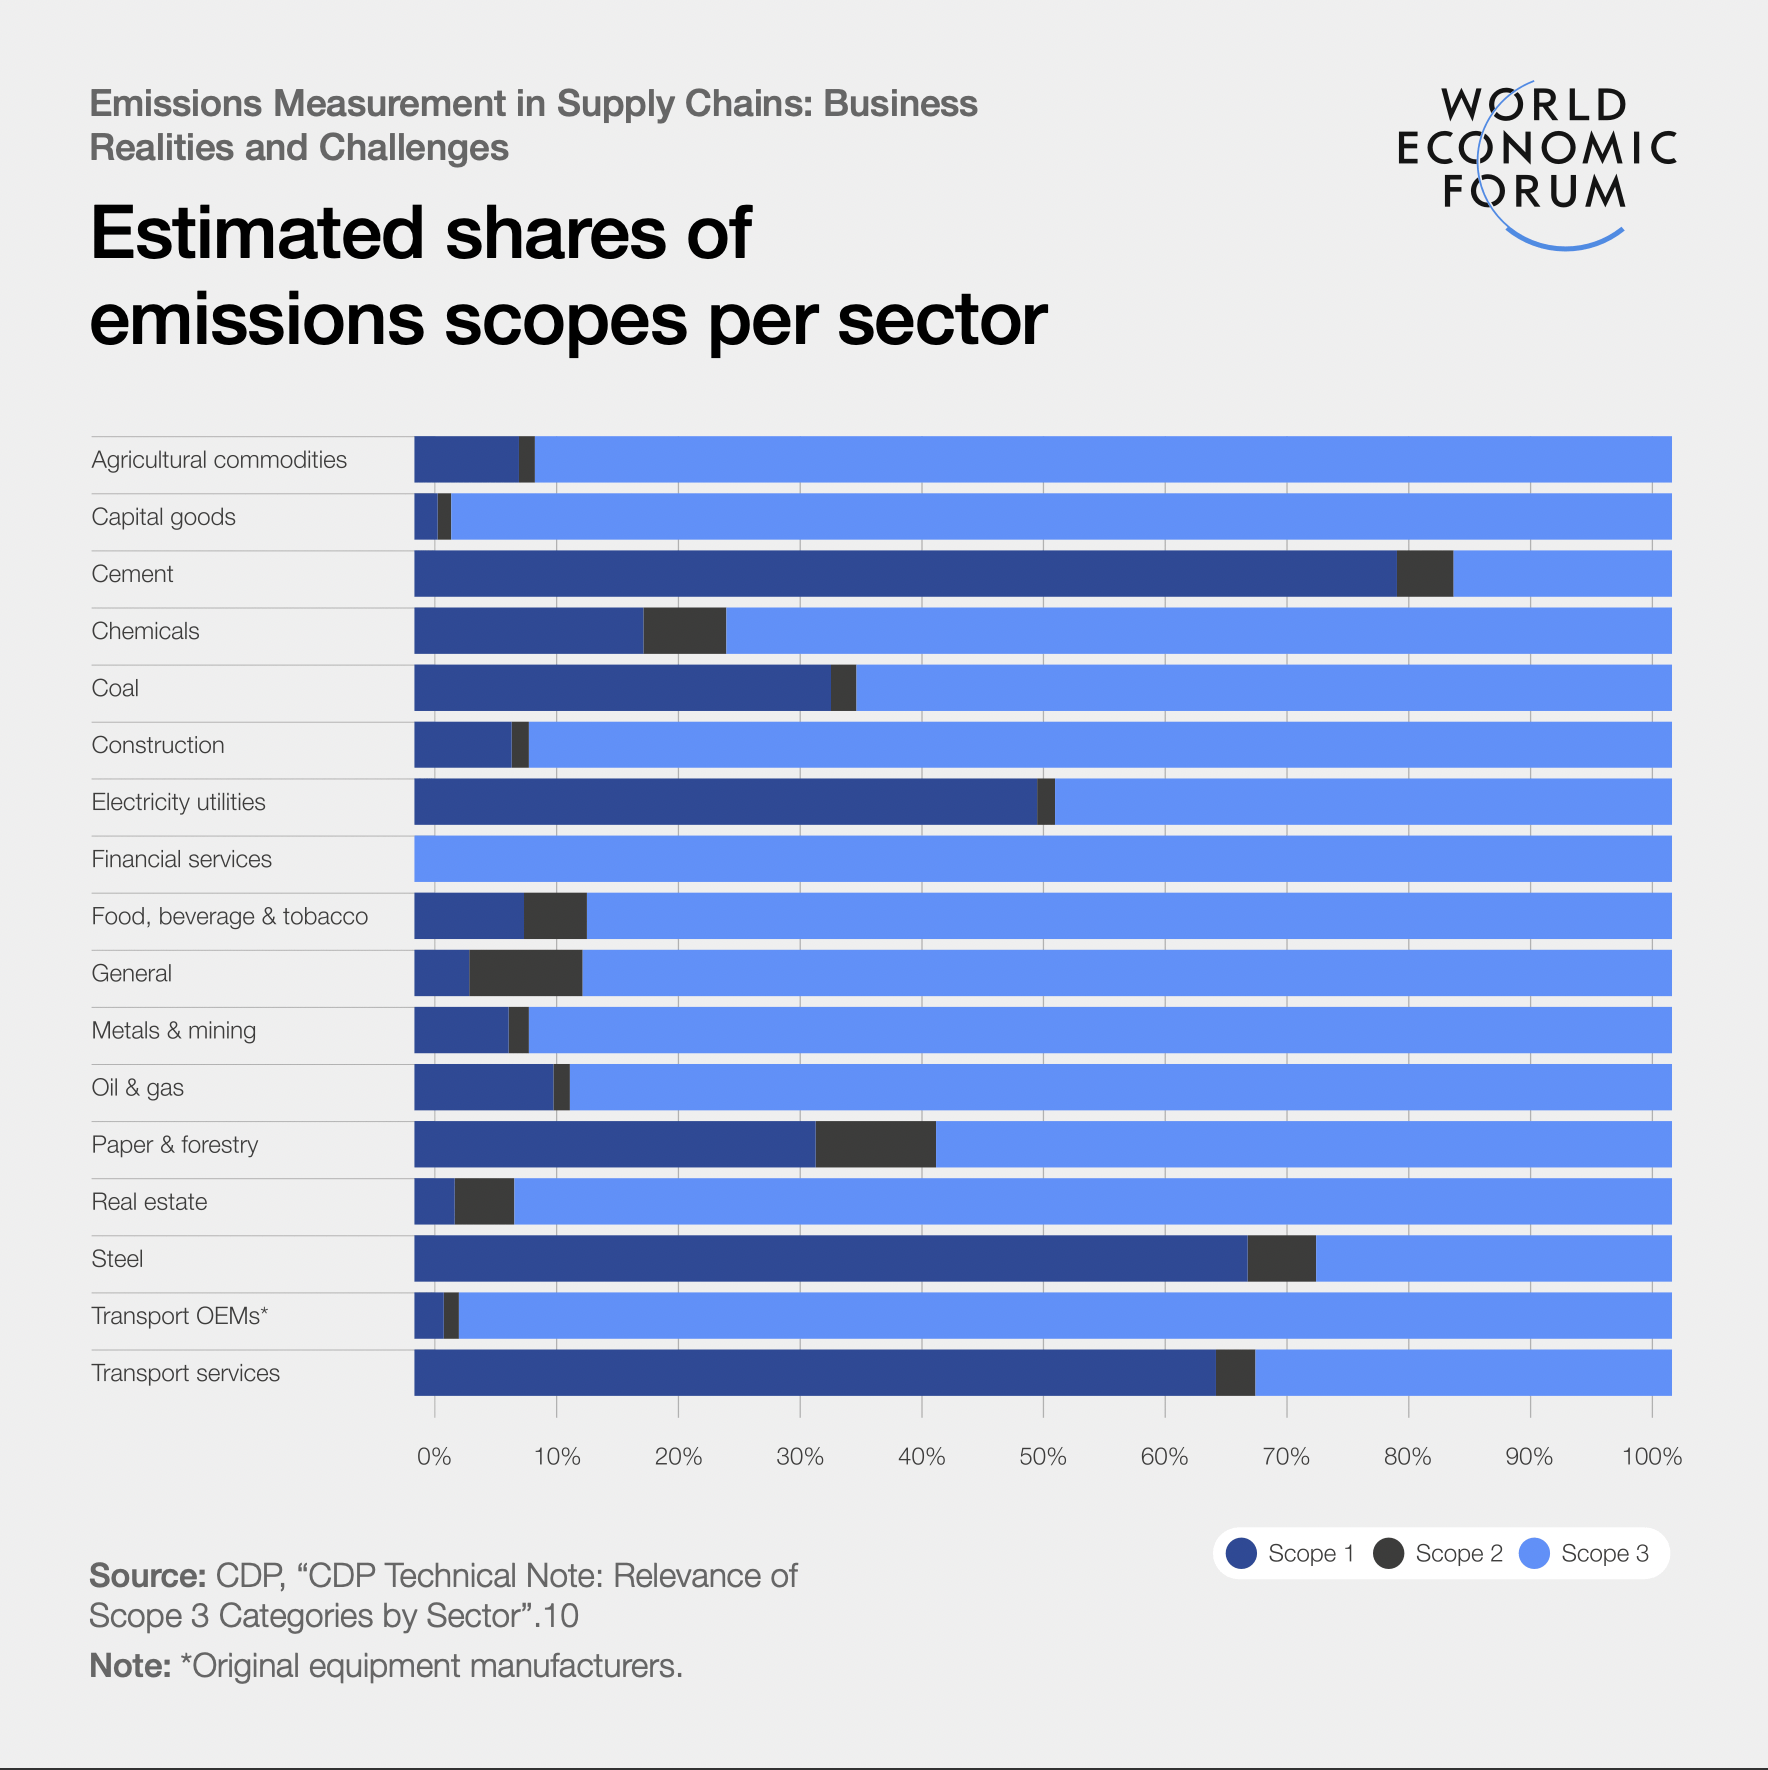
3 sectors share insights on measuring scope 3 emissions – World Economic Forum (December 4, 2023)
A McKinsey analysis found that within the retail sector, 98% of a retailer’s total attributable emissions come from upstream and downstream in its supply chain. This means that for retailers wanting to reduce their emissions, collaboration with suppliers is essential to create meaningful impact. The chart below provides a more granular view of the activities within Scope 3.
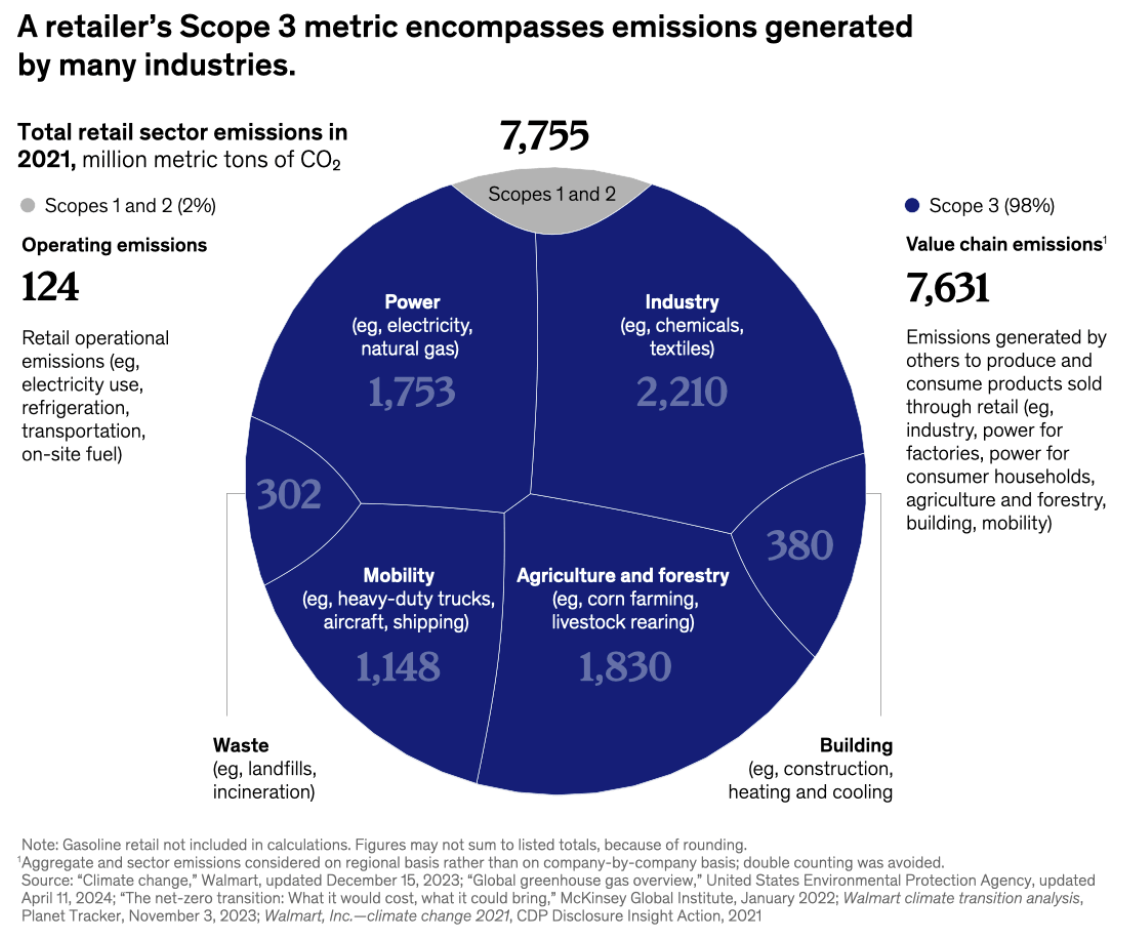
What lies beneath retail’s carbon emissions – McKinsey & Company (October 1, 2024)
Another analysis of the semiconductor fabrication industry attributes 20% of total emissions to Scope 3. A closer look reveals that purchased materials account for approximately 62% of upstream Scope 3 emissions, while maintenance and supplier transportation are responsible for about 22% and 6%, respectively.
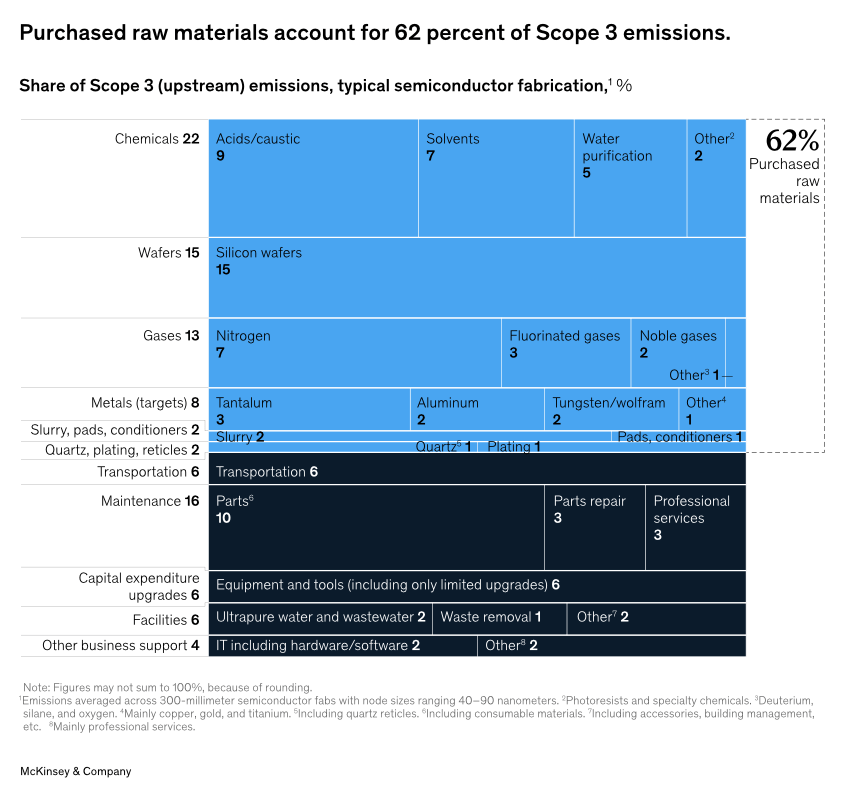
Beyond the fab: Decarbonizing Scope 3 upstream emissions – McKinsey & Company (October 9, 2023)
In conclusion, tackling emissions in supply chains is crucial for companies to meet regulatory requirements and enhance sustainability. As a large portion of emissions is embedded in upstream and downstream activities, collaboration with suppliers to improve practices can drive significant reductions. By focusing on operational efficiency and making informed supplier choices, businesses can minimize their environmental impact.
Help us make this series even better! We would love to hear your thoughts and suggestions on content makers we should follow to discover noteworthy projects and visualizations. Write to Bilal Siddika on LinkedIn or via email.
