
What better way to understand concepts big and small than through data visualizations? In this blog series, we curate insightful visuals to provide commentary on events, academic theories and themes related to economics and transportation. Join us as we explore and engage with interesting ideas from around the world.
Flip the page to the economy section, and you’re likely to find an article lamenting Canada’s fledgling labour productivity. The situation feels especially bleak when the divergence with your southern neighbour has been increasing. This week’s Data Vizdom brings a quick explainer on what productivity really means and how AI could be the answer to turning the tide.
Simply put, productivity measures the amount of output a worker produces in an hour of work. It is calculated by dividing GDP by the total number of hours worked, reflecting how efficiently a worker uses resources to produce goods and deliver services. Economists equate higher productivity with a better standard of living, as it often leads to higher wages and economic growth without necessarily causing inflation.
Productivity: output per hour worked – Our World in Data (2024)
There are significant variations in labor productivity across countries, and when analyzed alongside the average annual hours worked per worker, interesting patterns emerge. In richer countries with higher labor productivity, workers tend to work fewer hours to produce the same output. In contrast, countries with lower productivity often see workers putting in significantly more hours to compensate.
Annual working hours vs. labor productivity, 1950 to 2019 – Our World in Data (2024)
To understand this, we must first explore what drives growth in labour productivity. The recipe for increasing output is straightforward: by investing more capital and labor, you can generate higher output. However, the third ingredient—access to technology—is what sets competitive economies apart. This is represented by total factor productivity, as shown in the visualization below which dissects the drivers of growth in the US.
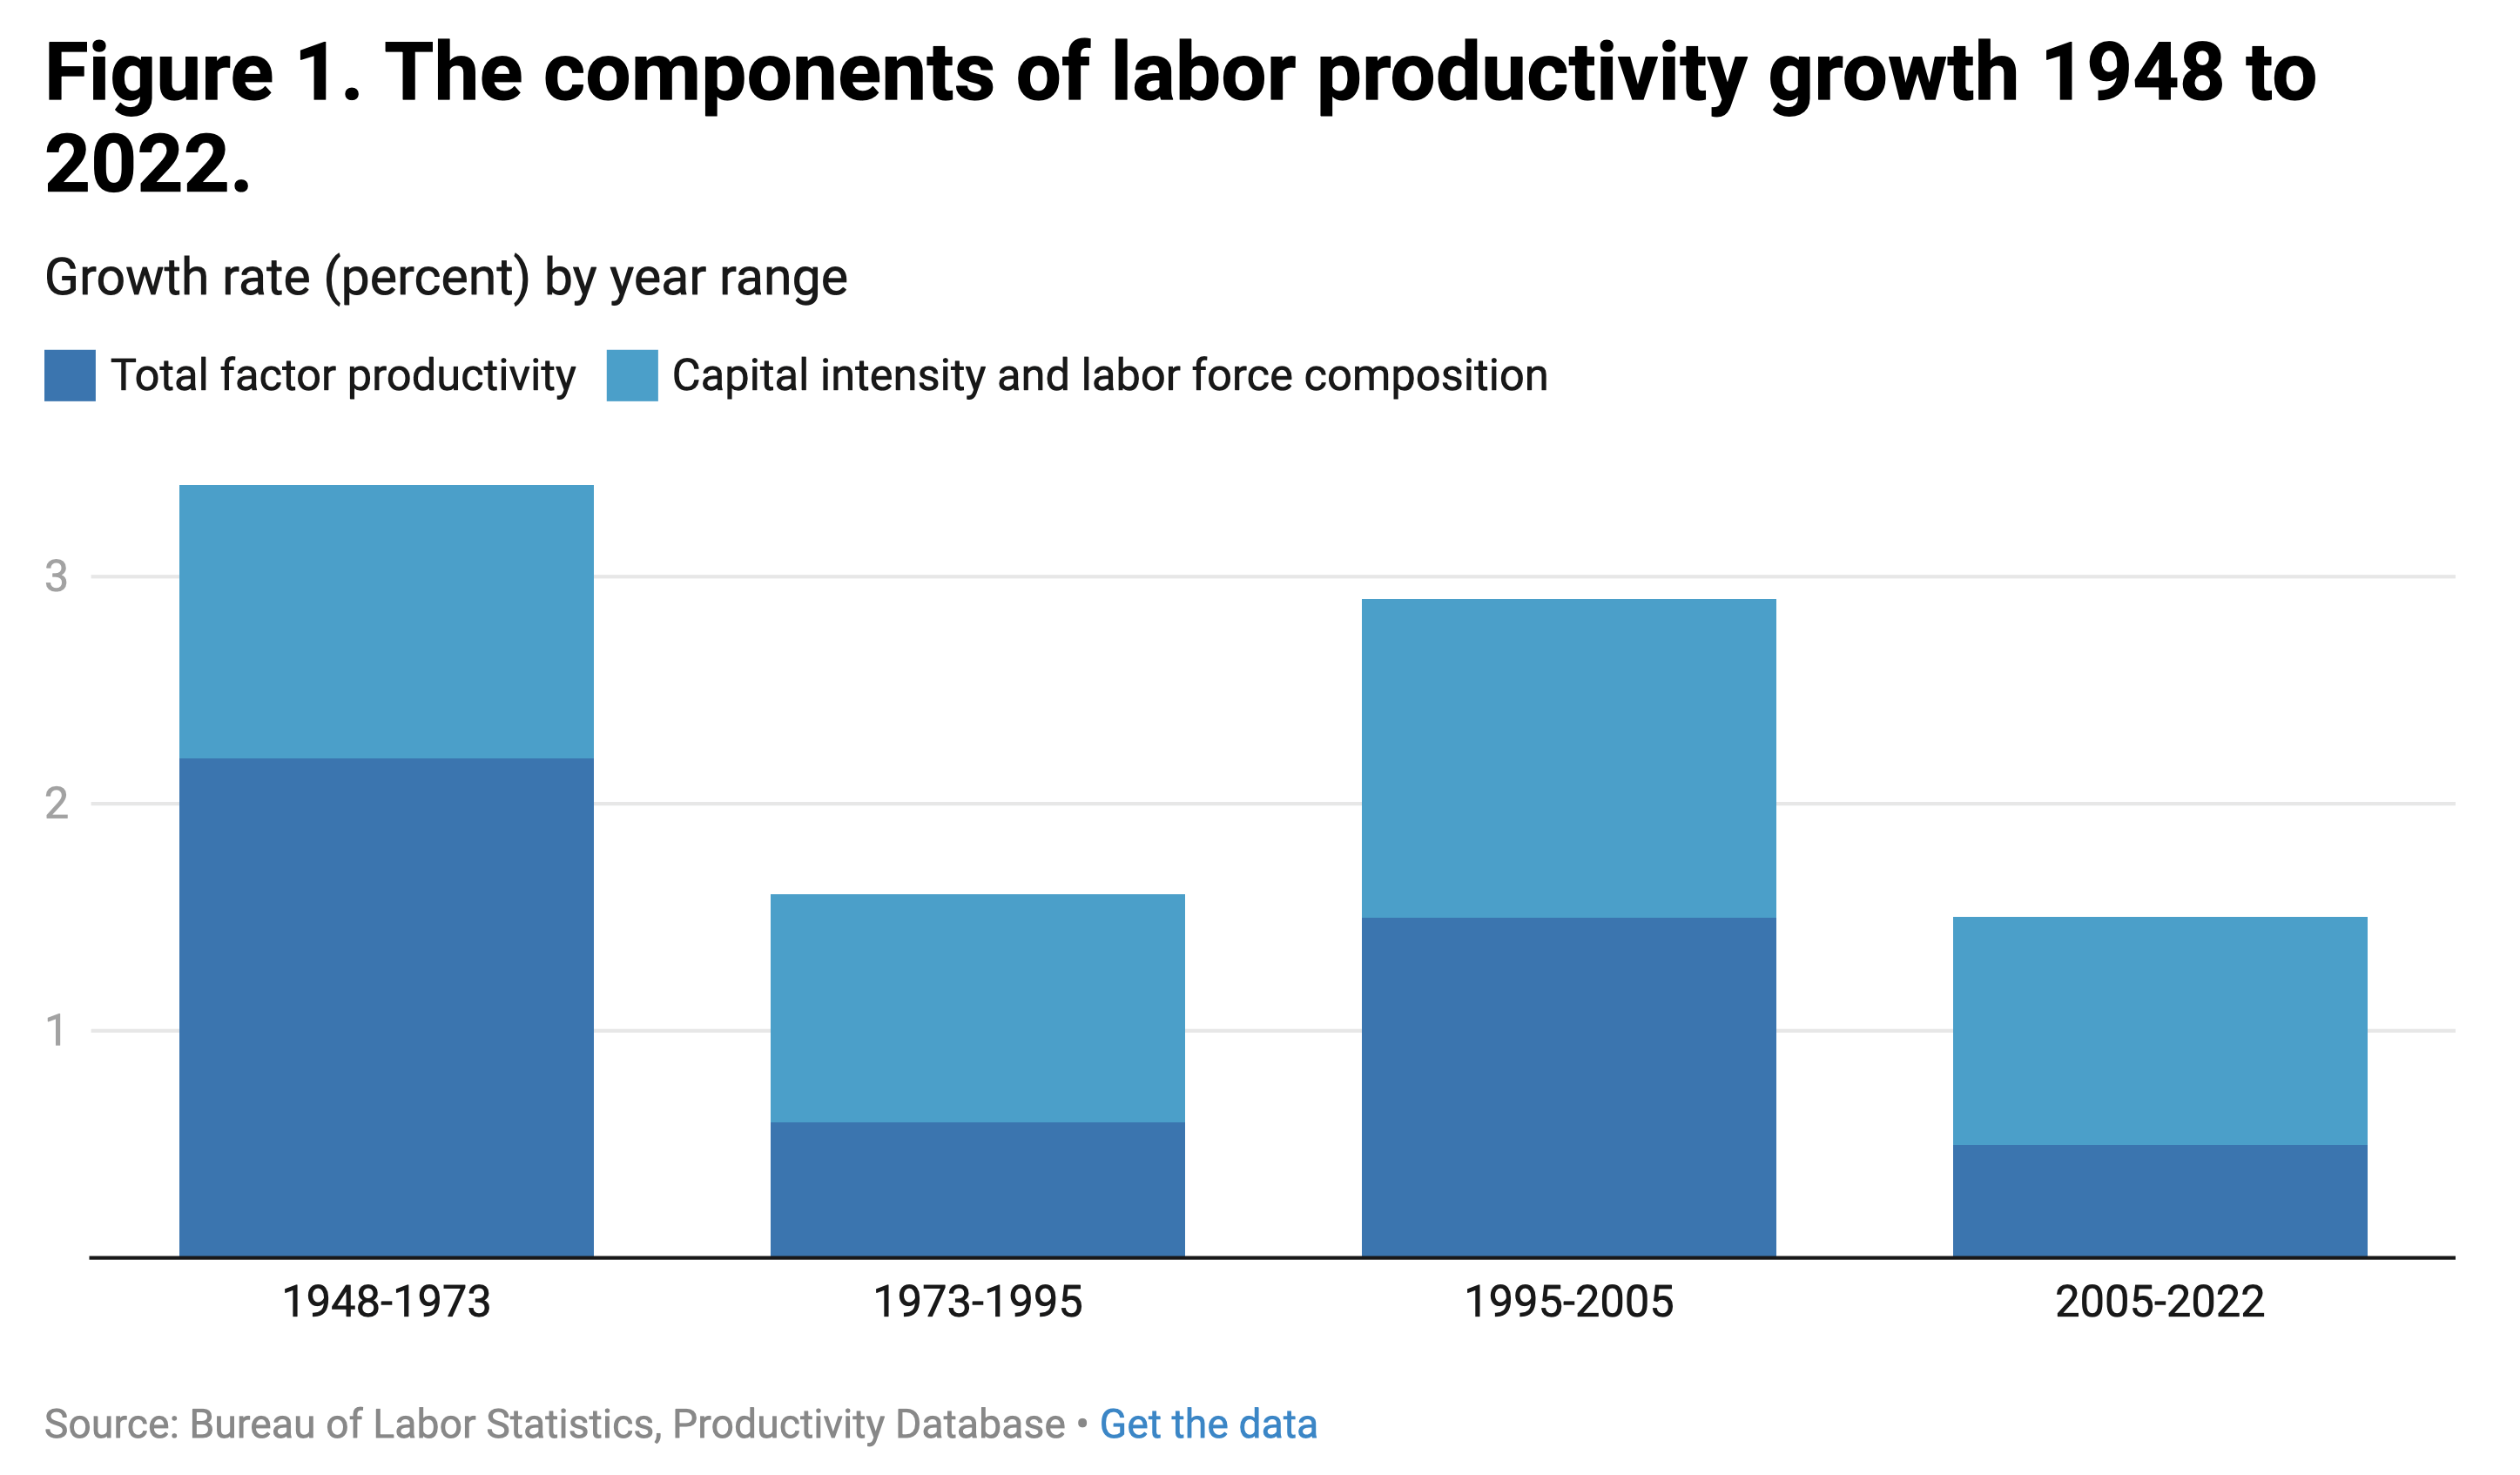
Machines of mind: The case for an AI-powered productivity boom – Brookings (May 10, 2023)
Now that we understand labor productivity, let’s go back and see where Canada stands compared to the U.S. As shown in the chart below, a Canadian worker produces only 79% of what their U.S. counterpart makes in an hour of work. Economists have identified numerous factors contributing to this disparity and have proposed solutions to address Canada’s productivity problem, but let’s focus on AI.
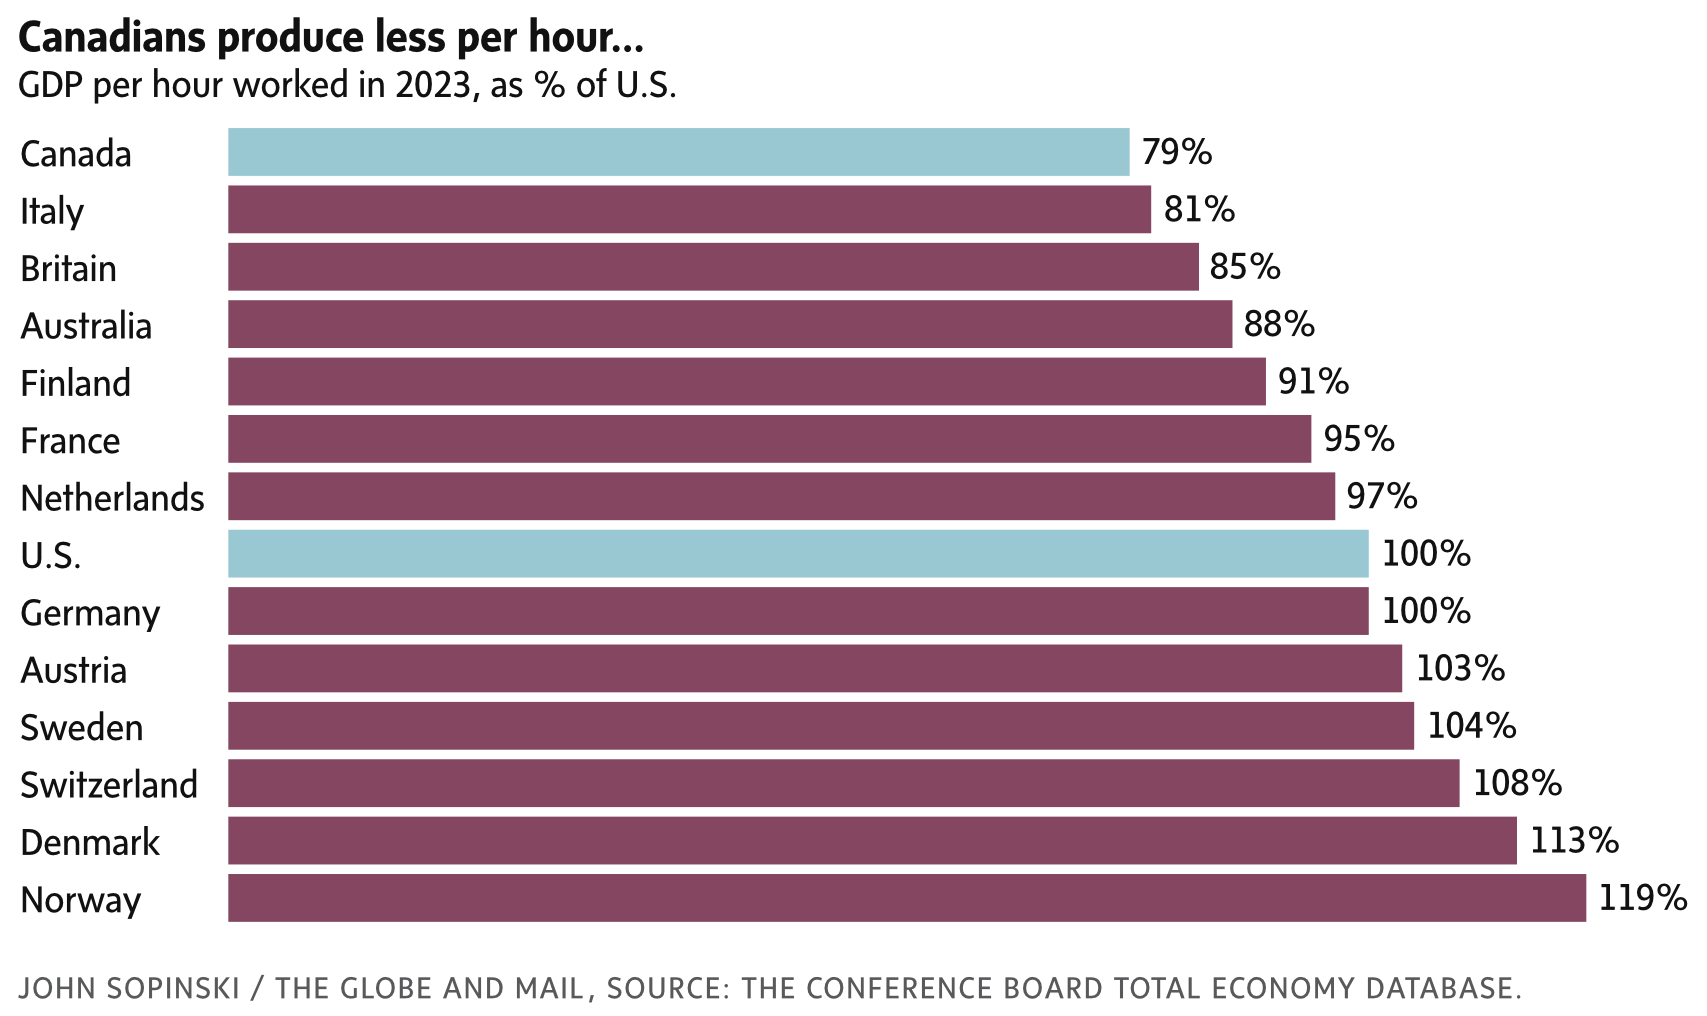
What is productivity and why is it so low in Canada? – The Globe and Mail (March 28, 2024)
AI, particularly generative AI, has the potential to transform the world in a manner similar to the impact computers had in the 1990s. Every passing month, generative AI is becoming more integrated into the workflows of millions of knowledge workers (myself included) around the world. McKinsey estimates that this would amount to $6.1 to $7.9 trillion annually. As its capabilities and applications expand, generative AI is expected to drive not just direct productivity growth but also accelerate innovation.
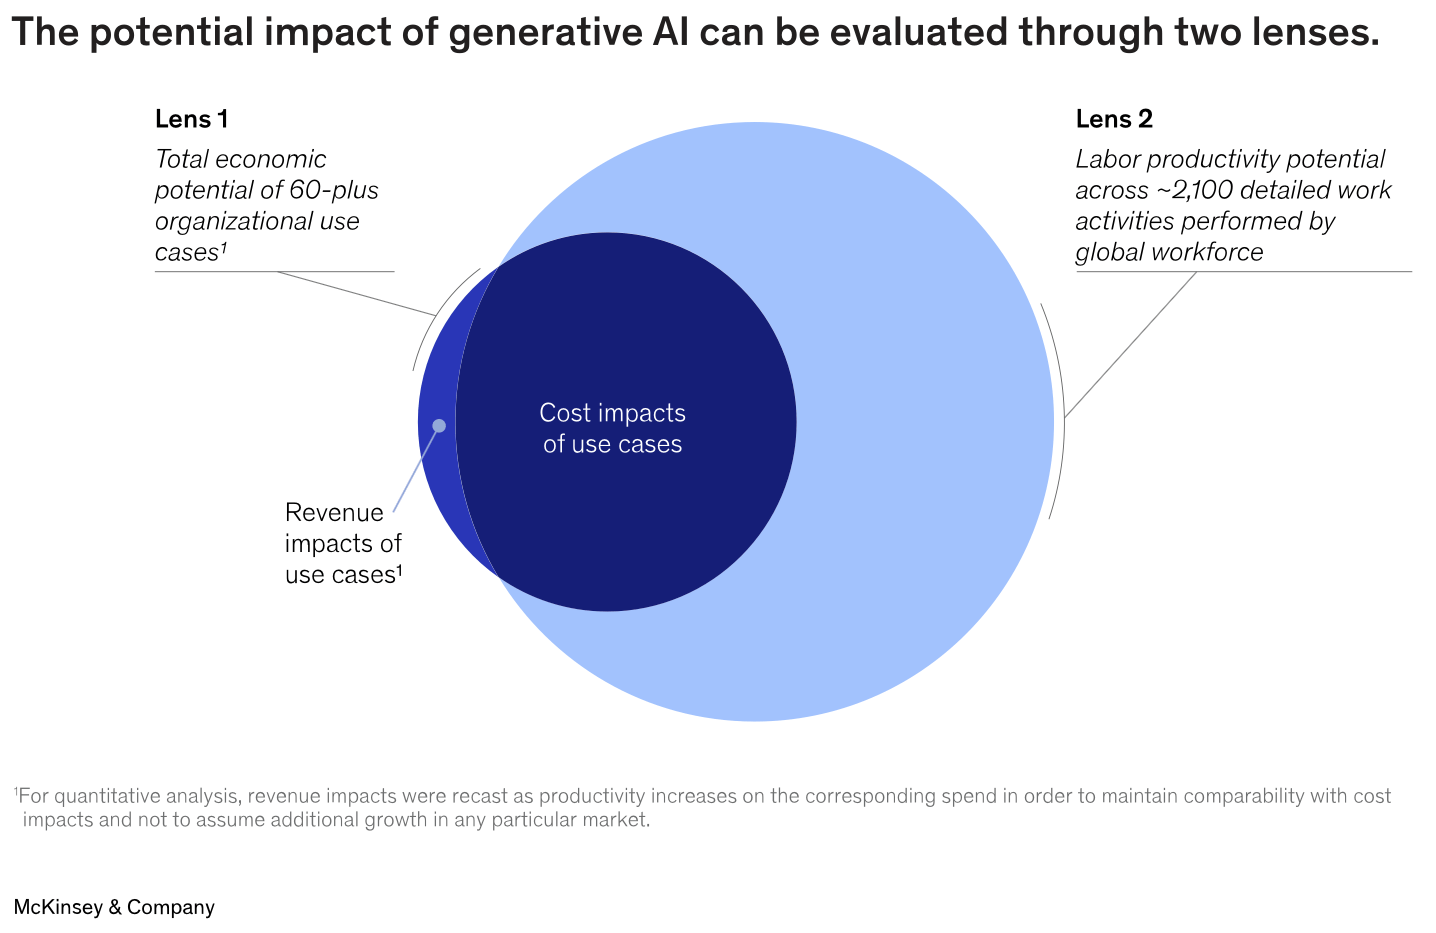
The economic potential of generative AI: The next productivity frontier – McKinsey & Company (June 14, 2023)
While generative AI holds great promise for enhancing efficiency and innovation, its effects and full impact on productivity will gradually become evident as it is integrated into people’s workflows. As Canada navigates its economic position, embracing and adapting to these advancements will be crucial for closing the productivity gap with its global counterparts.
Help us make this series even better! We would love to hear your thoughts and suggestions on content makers we should follow to discover noteworthy projects and visualizations. Write to Bilal Siddika on LinkedIn or via email.