What better way to understand concepts big and small than through data visualizations? In this blog series, we curate insightful visuals to provide commentary on events, academic theories and themes related to economics and transportation. Join us as we explore and engage with interesting ideas from around the world.
Over the past few years, international trade has undergone tumultuous times, and with trade protectionism on the rise, continued growth is uncertain. This week’s Data Vizdom appraises the current state of Free Trade Agreements (FTAs) — instruments designed to reduce trade barriers such as tariffs and quotas for all but certain goods crossing international borders between the signatories.
The rate of international trade’s growth fluctuates with variations in factors such as prices, interest rates and demand. However, with disruptive shifts in geopolitics and the ineffectiveness of supranational institutions in addressing current challenges, the world economy will have to weather structural changes. The visualization below breaks down international trade by commodities between partners, also highlighting the relative importance of each trade relationship for a pair.
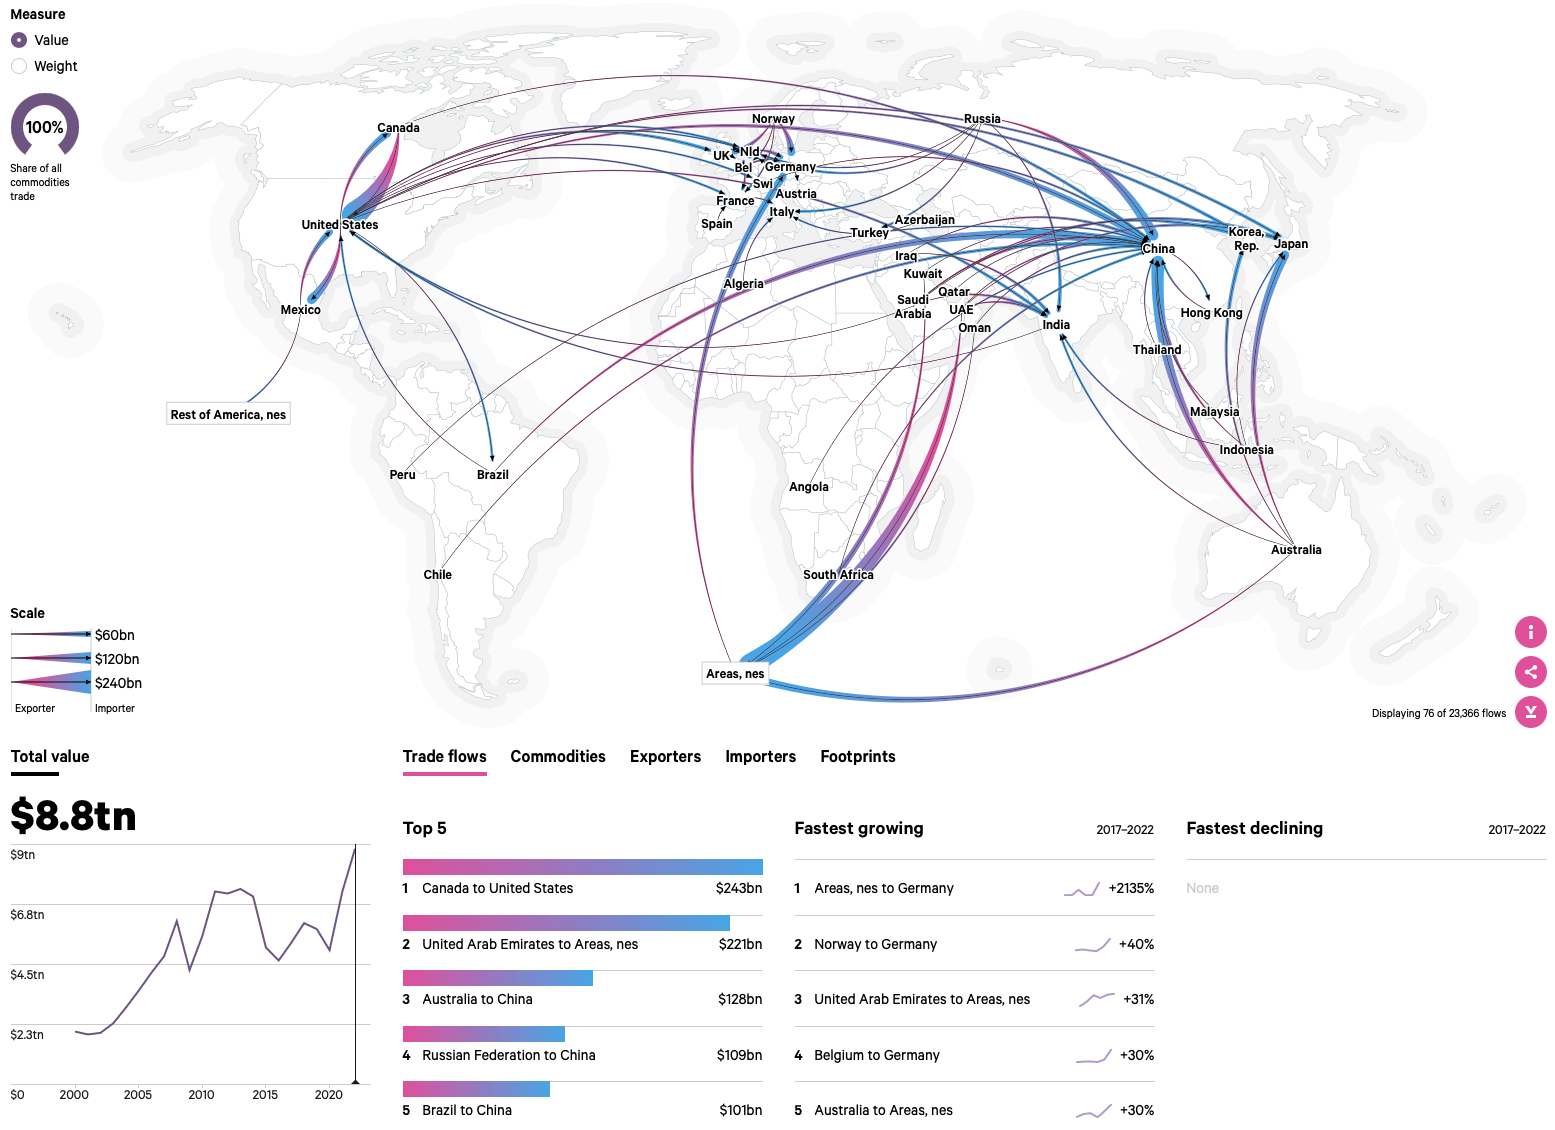
resourcetrade.earth – Chatham House (2024)
Looking back, ever since the 1970s, countries have been signing FTAs to gain improved access to each other’s markets. The number of such deals really picked up speed in the 1990s with the fall of the Soviet Union and continued into the 2000s, with an average of 13 deals made every year. Of late, new agreements have been sparse, with just two deals struck so far over this year.
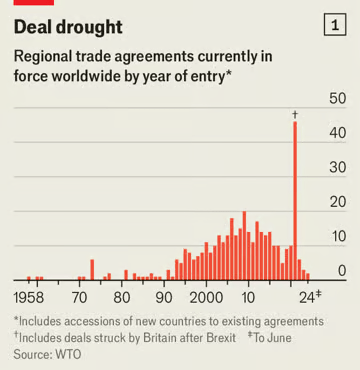
Rumours of the trade deal’s death are greatly exaggerated – The Economist (June 13, 2024)
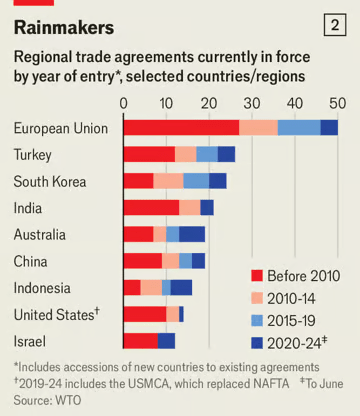
One potential reason for the slowdown in dealmaking could be the lack of potential partners with whom countries would want to establish favourable terms of trade. Examining the countries signing these agreements, the EU leads with 50 agreements currently in force, nearly half of which have been signed since 2010. China and the US, surprisingly, have far fewer agreements, with about 75% of the US’s agreements entered into before 2010.
The Boston Consulting Group has conducted an interesting analysis to understand the differing motivations of countries negotiating FTAs and to assess the quality of the agreements being signed. By analyzing FTAs between 100 major economies and trade blocs, they developed the Trade Engagement Index (TEI) tool to compare economies based on the usage, depth and relative strength of their trade agreements. Take a look at the visualization below to see how different economies compare with each other.
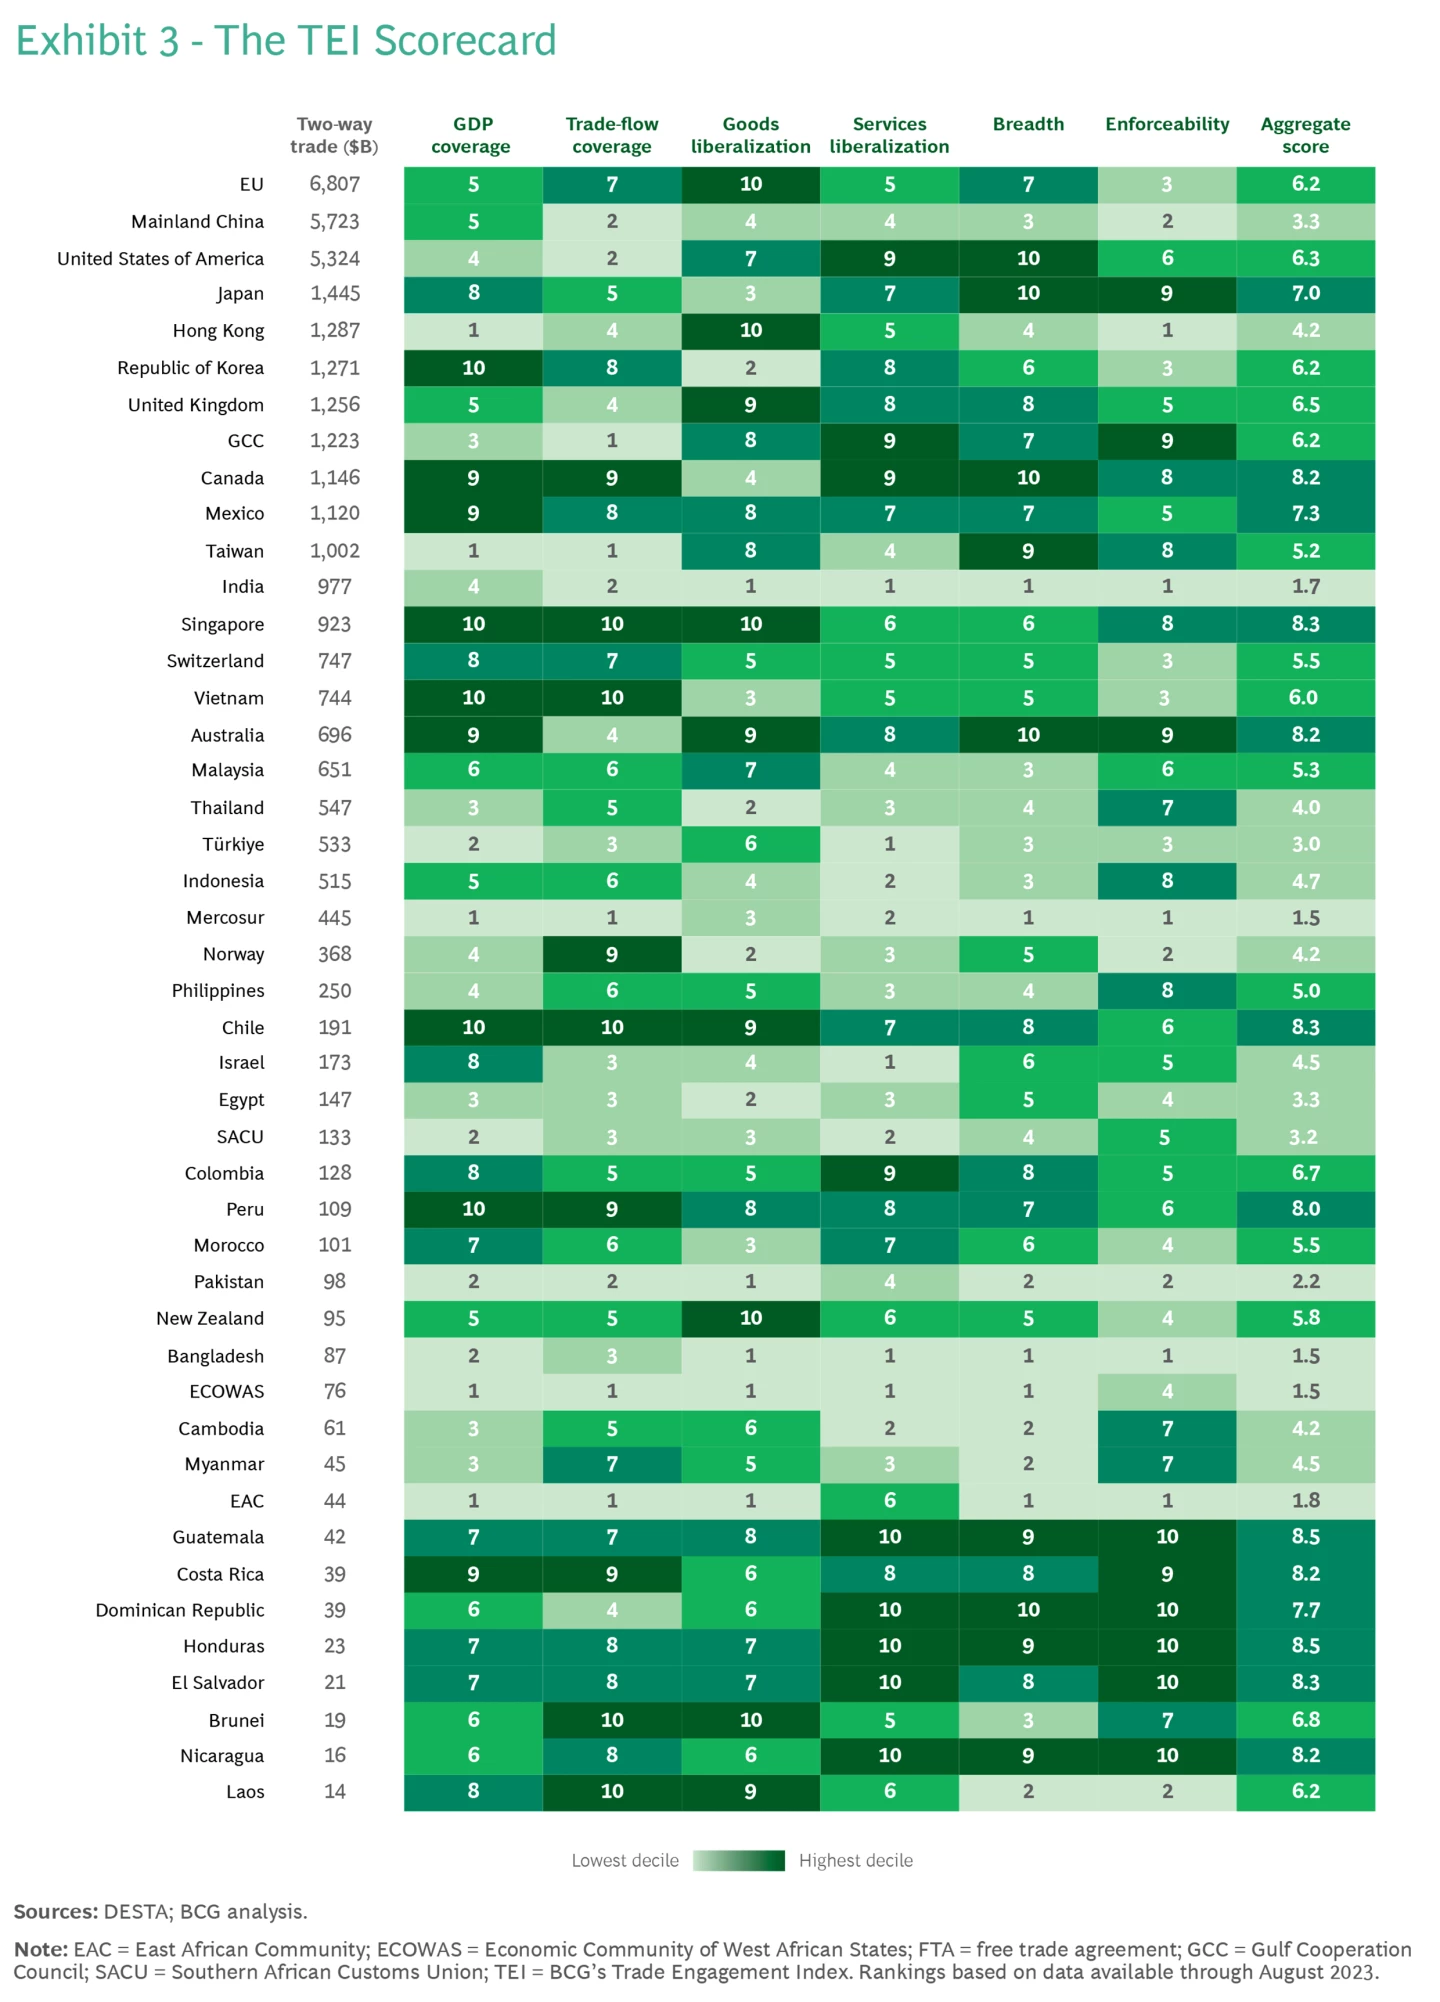
Which Economies Benefit the Most from Free Trade Agreements? – Boston Consulting Group (February 26, 2024)
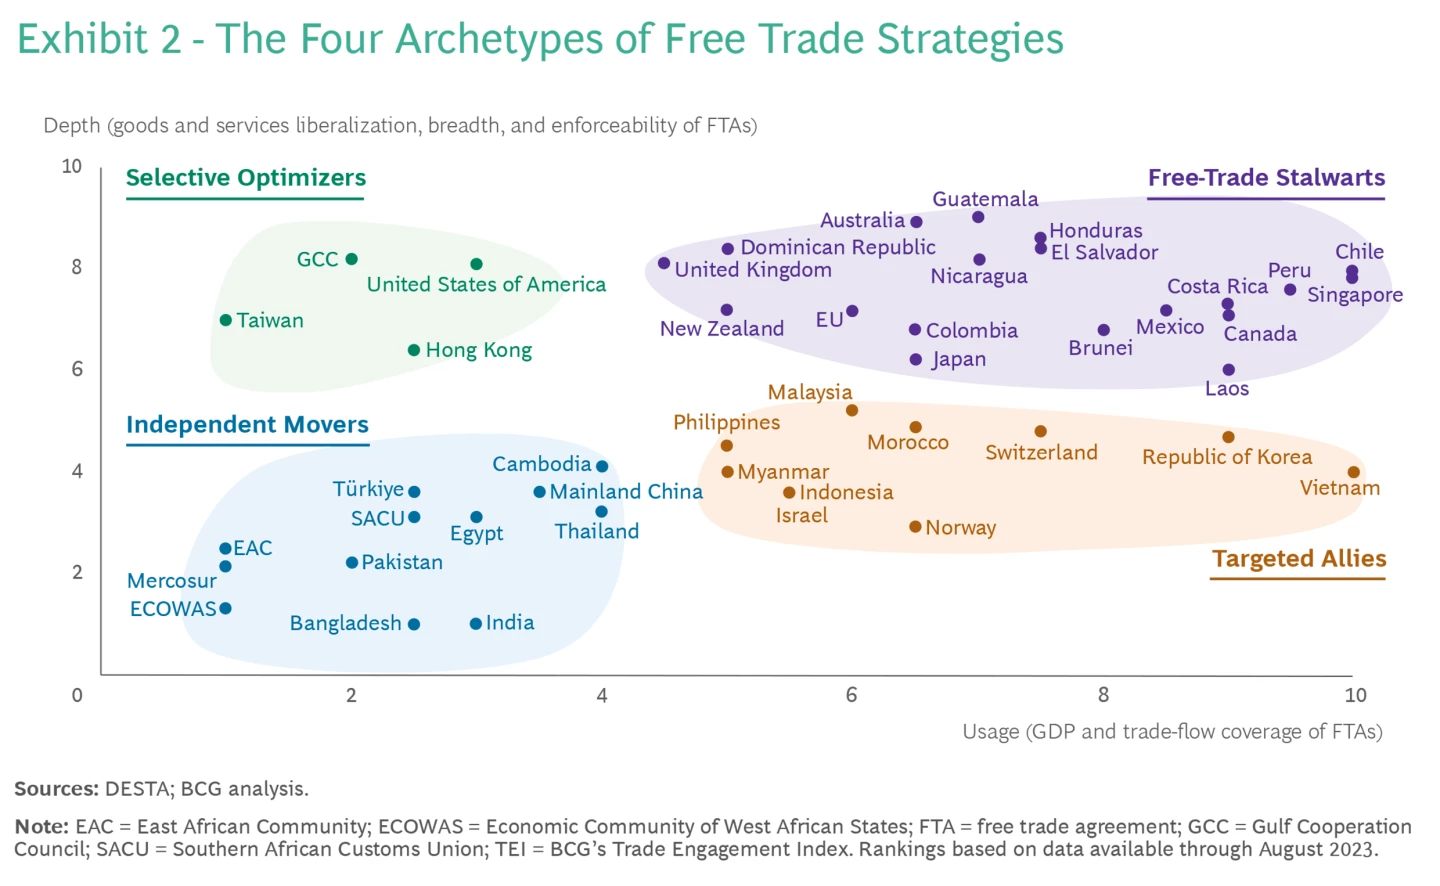
They chart the economies based on their scores and categorize them as shown in the visualization below. Countries with the highest usage and depth of FTAs are termed Free-Trade Stalwarts, typically smaller economies that heavily rely on trade. On the opposite side, Independent Movers are countries that rely less on FTAs, either to protect their domestic industries or due to other strategic reasons. Such as China’s use of its scale and competitive cost to access markets.
In conclusion, as negotiating FTAs becomes increasingly time-consuming and complex, smaller scale agreements that address non-tariff barriers are becoming more popular. These targeted deals can be established more quickly and often deliver trade benefits that, in some cases, exceed those of FTAs. Despite this, FTAs continue to be negotiated as countries seek to address broader trade issues and secure long-term economic benefits.
Help us make this series even better! We would love to hear your thoughts and suggestions on content makers we should follow to discover noteworthy projects and visualizations. Write to Bilal Siddika on LinkedIn or via email.