
What better way to understand concepts big and small than through data visualizations? In this blog series, we bring you a collection of visuals on events, academic theories, and insights around economics and transportation, especially — but not exclusively — from academia and news organizations. Join us to explore and engage with interesting and insightful data visualizations from creators around the world.
This week’s Data Vizdom looks at carbon markets, a system where CO2 emission units or carbon credits are traded. This effectively sets a price on carbon and incentivizes reductions in its emission.
Take a look at annual CO2 emissions, and it becomes clear that developing countries account for over two-thirds of the total. This is not surprising in a world with global supply chains where high-emission activities such as mining, farming and manufacturing are concentrated outside the cost-prohibitive developed world. Data on historical CO2 emissions over the last 170 years attributes half of all emissions to rich countries, which comprise only 12% of the world’s population.
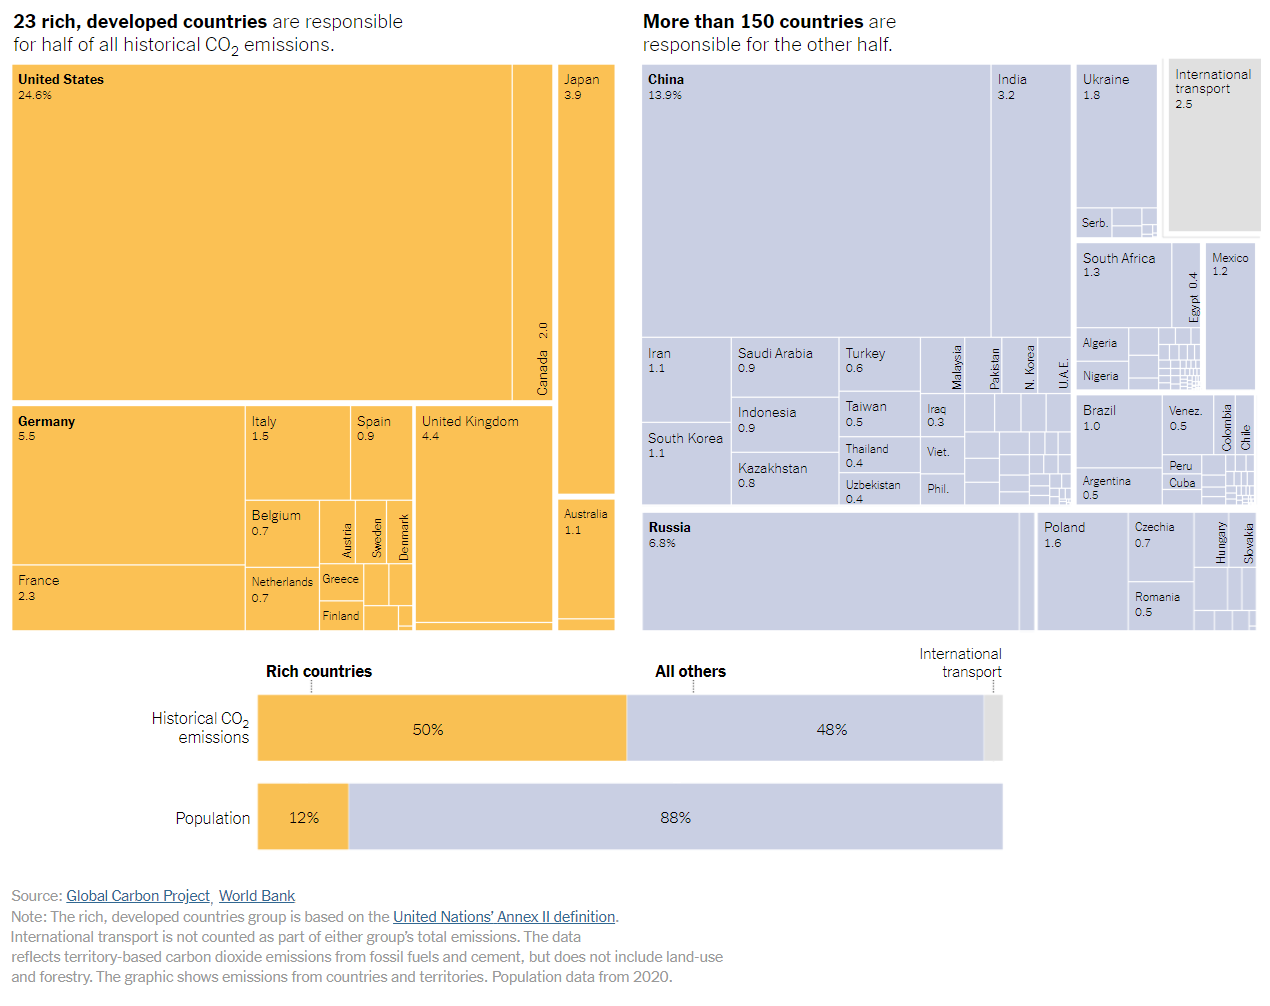
Who Has The Most Historical Responsibility for Climate Change? – The New York Times (November 12, 2021)
While historical responsibility for carbon emissions remains a concern, countries have been experimenting with setting a price on carbon to meet their climate pledges. Two key measures have been designed to encourage companies to invest in lowering their emissions. The first is levying a tax on a company’s carbon emissions based on volume. The second is establishing a system that allows companies to trade carbon credits, which permit them to emit one ton of CO2 per unit. The latter, known as emissions trading systems, have been gaining popularity of late.
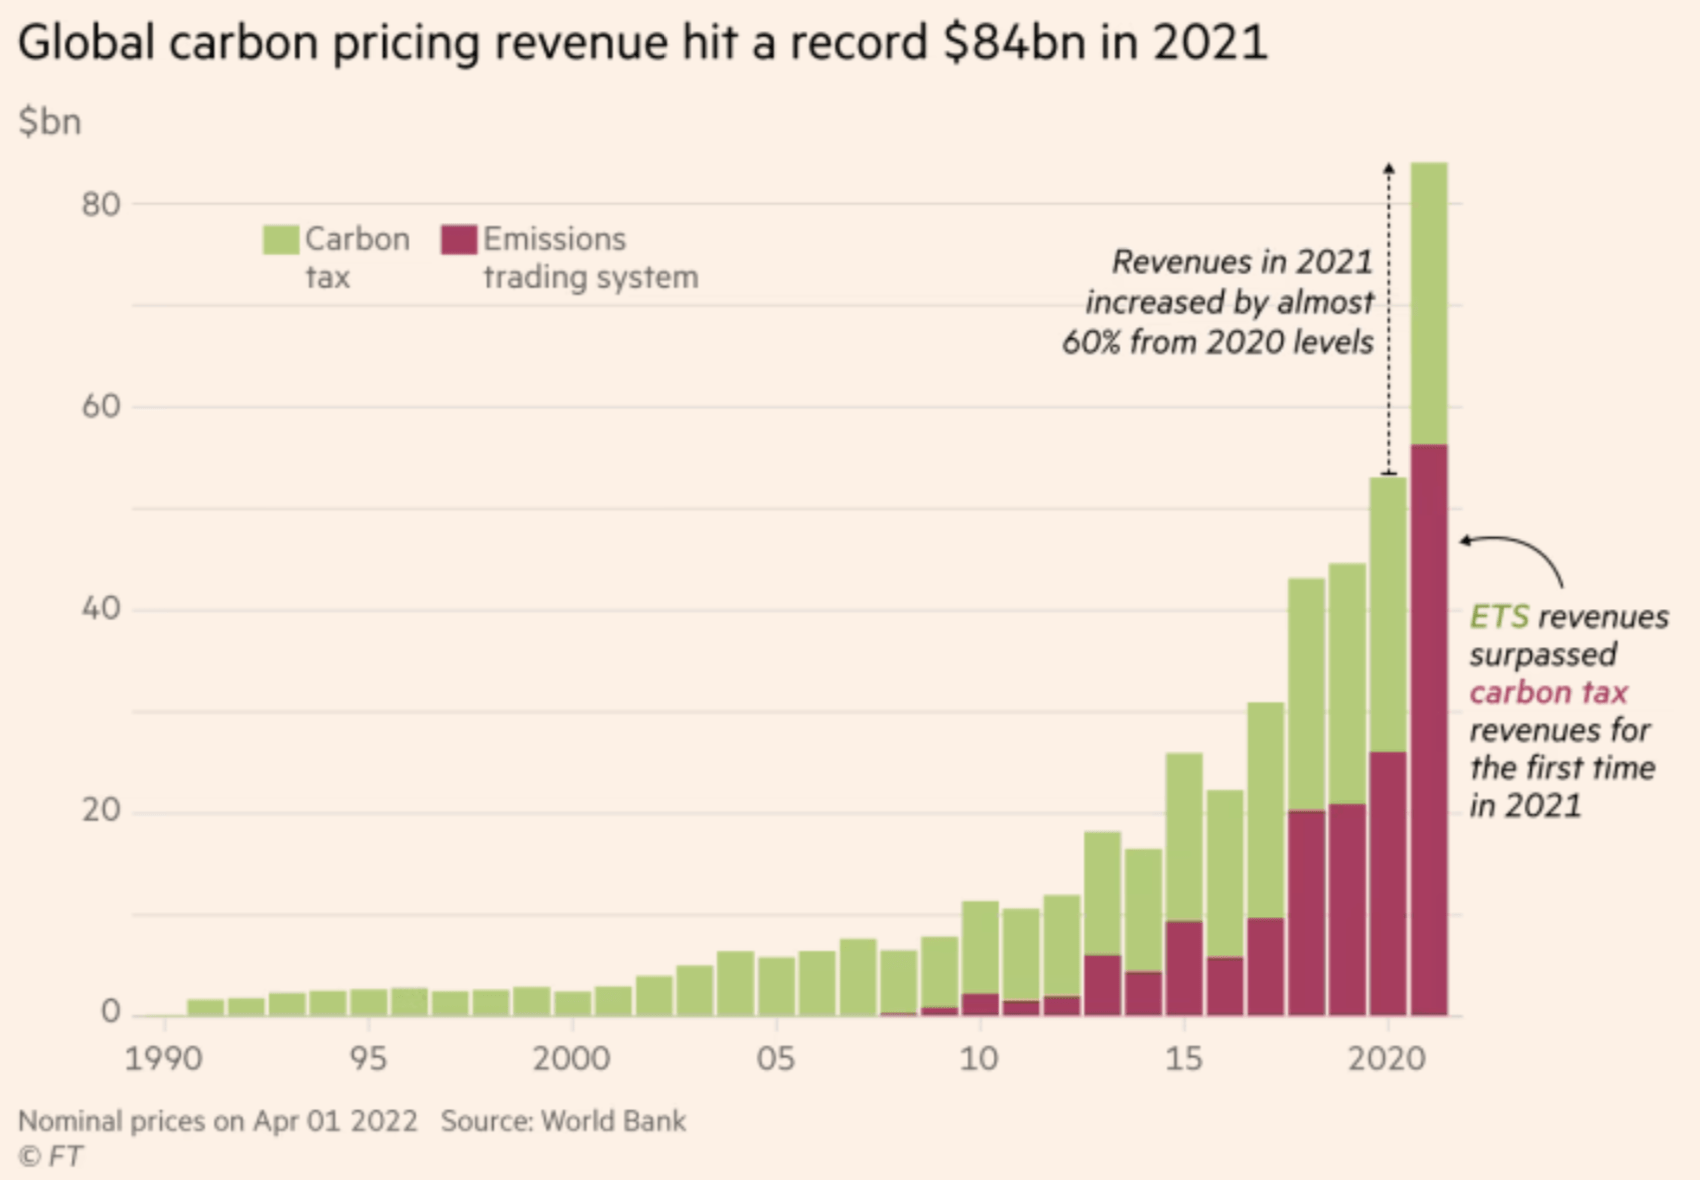
Climate graphic of the week: Carbon pricing reaps $84bn but falls ‘well below’ climate goals – Financial Times (May 27, 2022)
Carbon markets are of two types: compliance and voluntary. Under the compliance system, governments set an overall cap on emissions and allocate limits to companies through the granting of credits. These carbon credits can be used by companies to emit up to their allocated limit or sold to other companies, effectively making it more expensive to pollute at status-quo levels. Credits can also be created by reducing or removing CO2, such as through the use of solar panels or carbon capture technology. In voluntary markets, credits are generated when companies invest in carbon reduction projects.
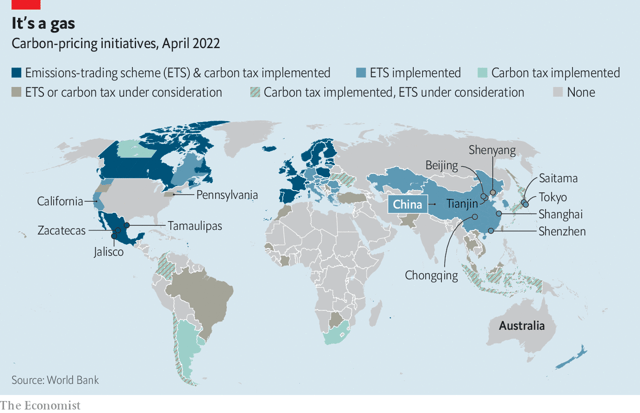
Carbon markets are going global – The Economist (May 26, 2022)
With each new compliance market and carbon tax levied, a greater percentage of GHG emissions is covered and priced. Currently, almost a quarter of all GHG emissions are covered under carbon-pricing initiatives.
The price for carbon credits varies depending on the market, with prices in compliance markets far outpacing those in voluntary markets. The market size of the former reached $850 billion in 2021. In fact, the commodification of carbon has allowed individual investors to speculate while also contributing to climate action.
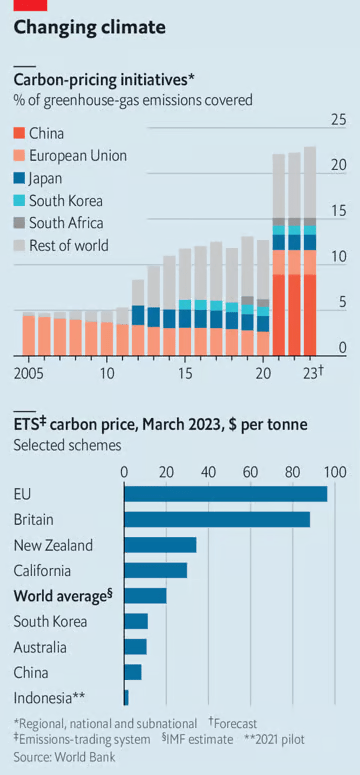
How carbon prices are taking over the world – The Economist (October 1, 2023)
The demand for voluntary credits is expanding, driven by climate-friendly projects in the developing world. Startups in Africa, for example, are generating credits by selling cleaner fuels such as bioethanol to replace firewood and charcoal used for cooking. Profits from the sale of carbon credits are used to reduce the market price of these fuels. The African Carbon Markets Initiative (ACMI) estimates that the continent is currently harnessing only 2% of its potential, with a goal to sell $100 billion worth of credits annually by 2050.
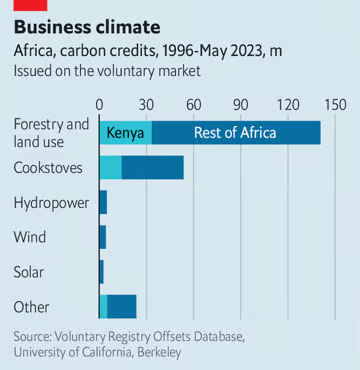
Could carbon credits be Africa’s next big export? – The Economist (November 30, 2023)
While critics have questioned the efficacy of carbon markets in reducing emissions, an increasing number of governments are establishing new compliance markets. With greater global adoption, trading in credits is expected to rise, thereby raising the cost of polluting our planet.
Help us make this series even better! We would love to hear about sources we should follow to discover interesting projects and visualizations. Write to Bilal Siddika on LinkedIn or via email.