
What better way to understand concepts big and small than through data visualizations? In this blog series, we bring you a collection of visuals on events, academic theories, and insights around economics and transportation, especially — but not exclusively — from academia and news organizations. Join us to explore and engage with interesting and insightful data visualizations from creators around the world.
This week’s Data Vizdom continues from where we left off, examining the ongoing conflict in the Red Sea and its effects on maritime traffic, delays, and shipping costs.
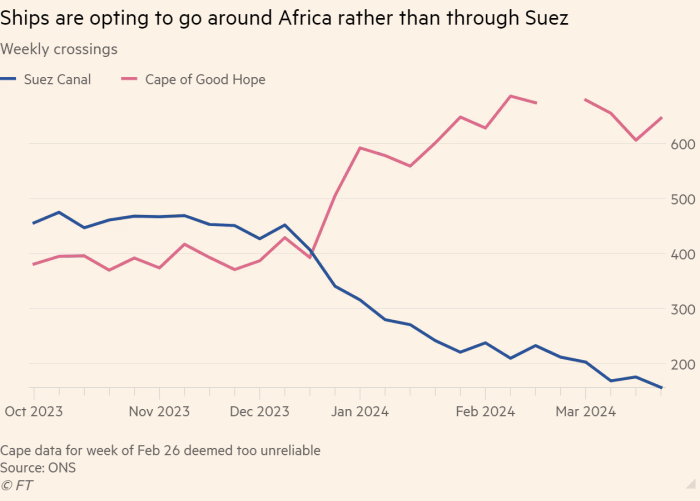
Data on ship movements show the extent of change the Red Sea blockade has caused on maritime shipping through the Bab el-Mandeb strait from December 2023 to February 2024.
Navigating Troubled Waters – UNCTAD (February 2024)
The drop in traffic transiting through the Suez Canal and the rise in traffic transiting through the Cape of Good Hope is roughly about the same.
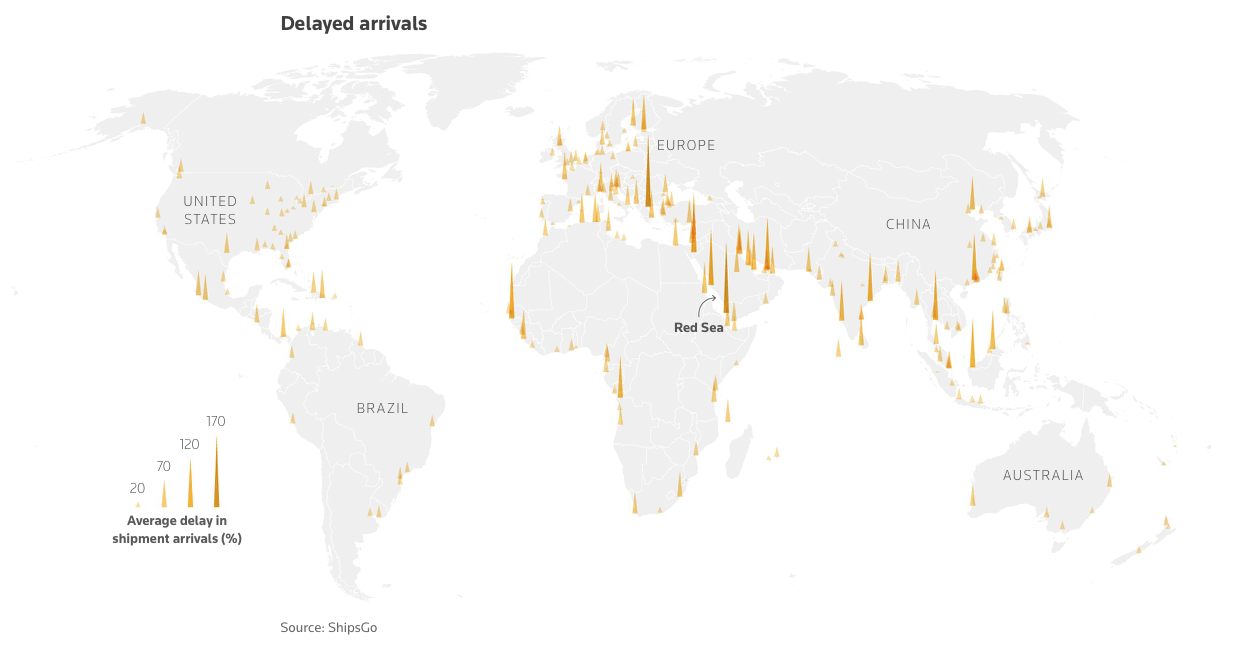
The mounting strains on global shipping – Financial Times (May 28, 2024)
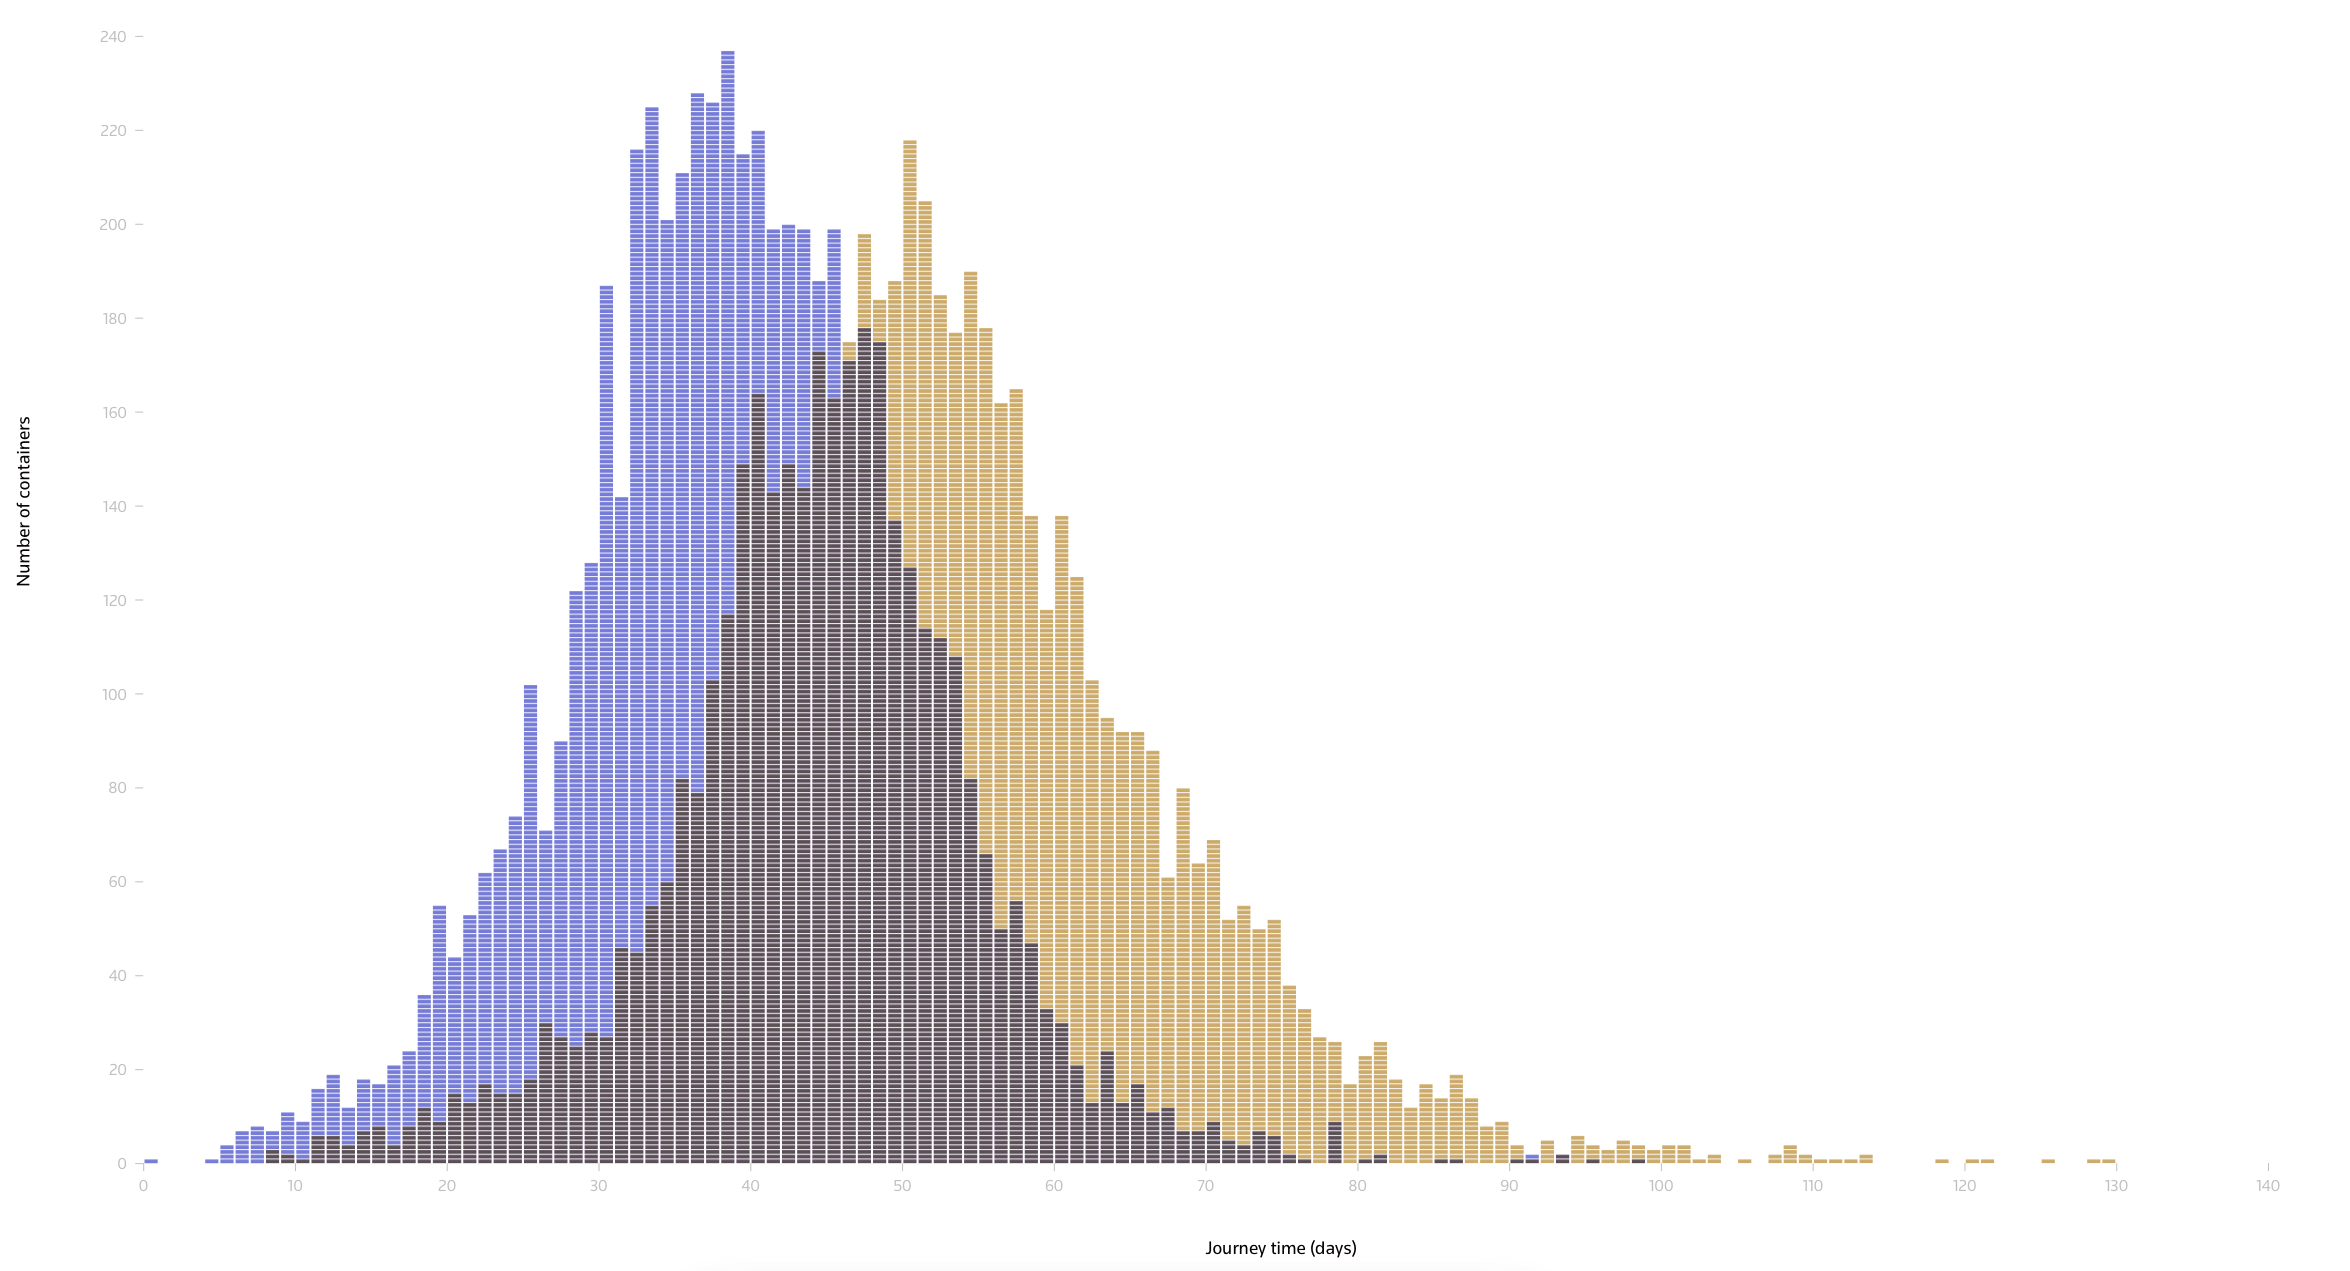
The delays caused by this blockade has had a cascading effect on ship arrivals and port congestion, aggravating delays beyond the additional ten days attributable to the re-routing.
Escalating emissions – Reuters (May 28, 2024)
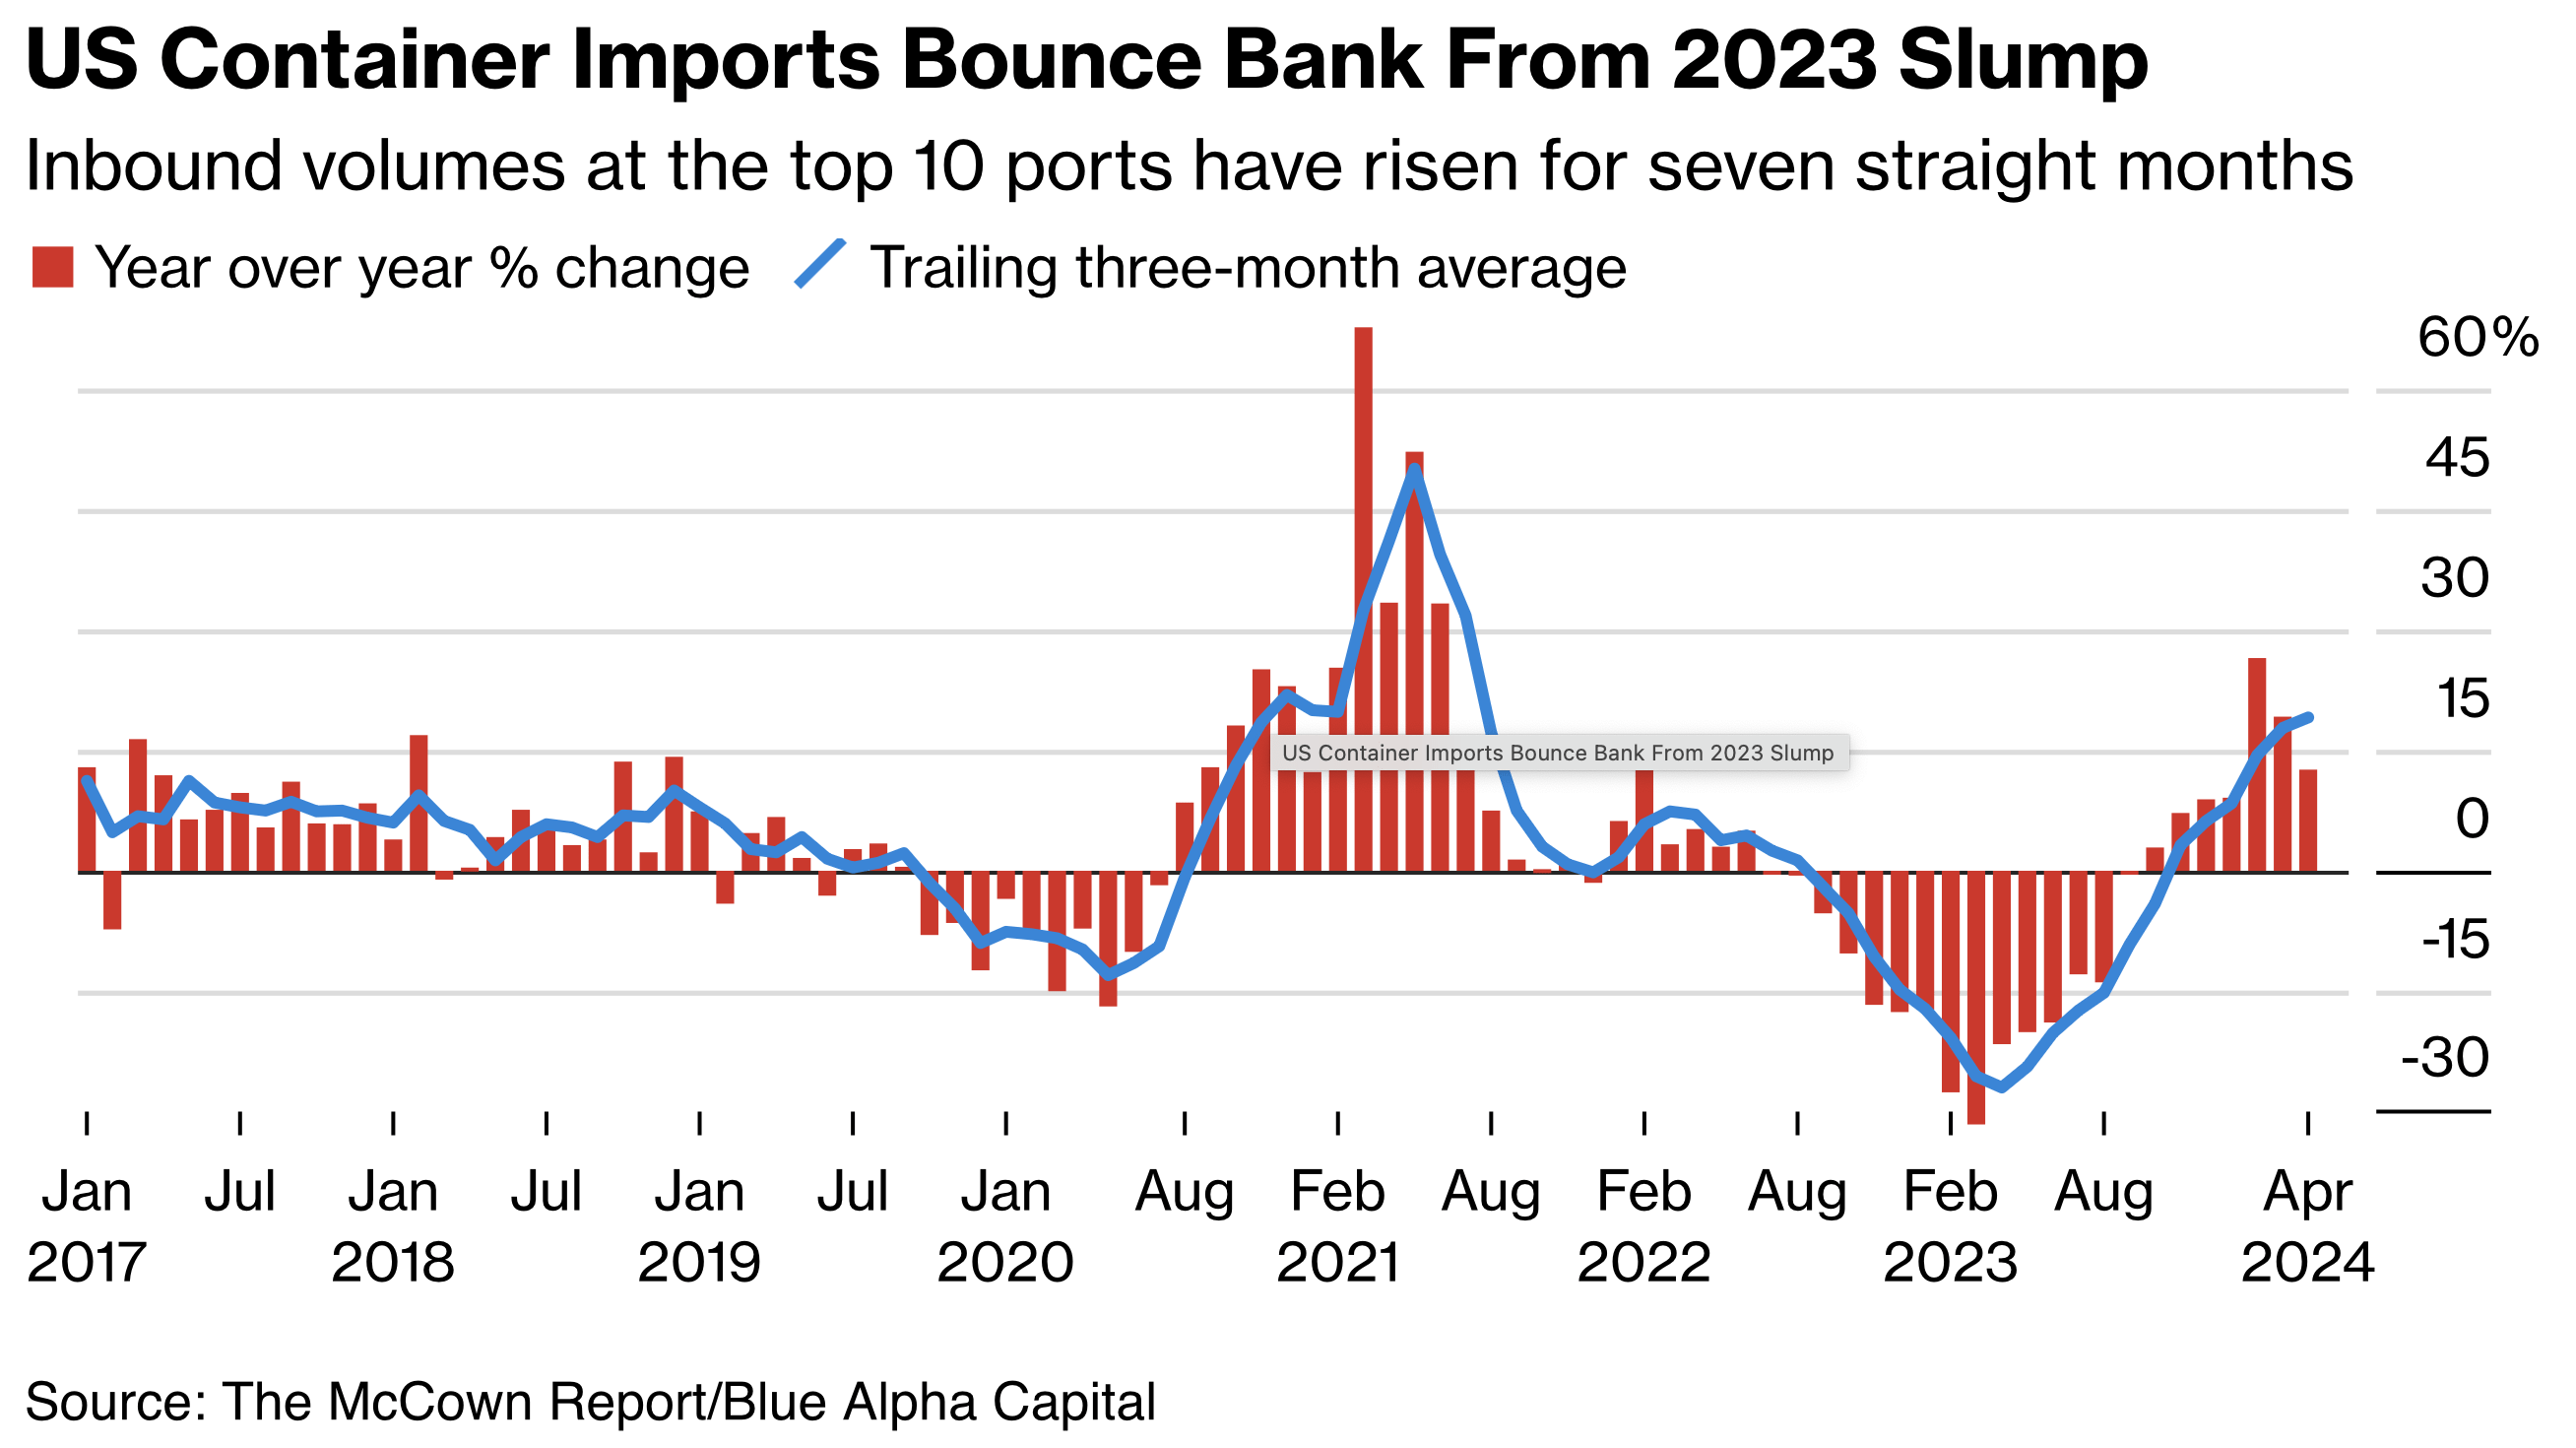
The disruption in maritime shipping and congestion at ports have created a supply crunch for maritime freight in the market. This has caused a reversal in the post-pandemic recovery of shipping prices.
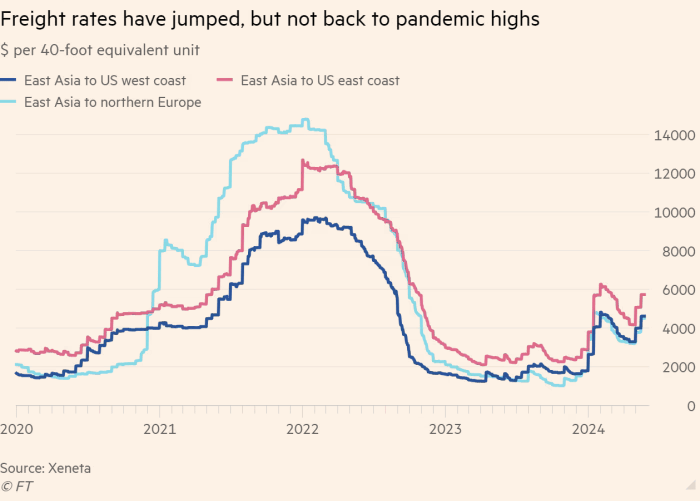
With demand for goods picking up in the US and Europe, shipping companies have had to change their stock strategy to accommodate the longer lead times and uncertainty.
Trade Strains Boost Cargo Rates at Pace Recalling Covid ‘Chaos’ – Bloomberg (May 27, 2024)
Help us make this series even better! We would love to hear about sources we should follow to discover interesting projects and visualizations. Write to Bilal Siddika on LinkedIn or via email.