
What better way to understand concepts big and small than through data visualizations? In this blog series, we bring you a collection of visuals on events, academic theories, and insights around economics and transportation, especially — but not exclusively — from academia and news organizations. Join us to explore and engage with interesting and insightful data visualizations from creators around the world.
The first edition of Data Vizdom (😉) looks at the ongoing conflict in the Red Sea and the effect the shipping lane blockade has had on international trade.
Let us first look at how freight moves through the global transportation system. The following chart shows the domination of maritime transportation in freight movement during 2015 and 2020. The demand for this mode is projected to continue overshadowing the other modes of transportation under three differing scenarios of decarbonization.
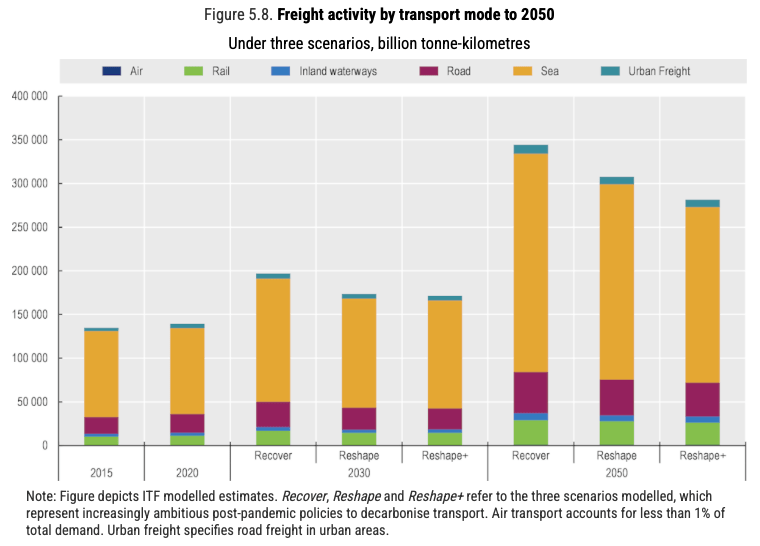
ITF Transport Outlook 2021 – ITF (May 17, 2021)
Ships ply on global shipping lanes that are optimized to reduce the distance between ports, helping reduce the time it takes to trade with partners from around the world. The movement of ships through these shortcuts have created chokepoints that handle a disproportionate share of maritime traffic.
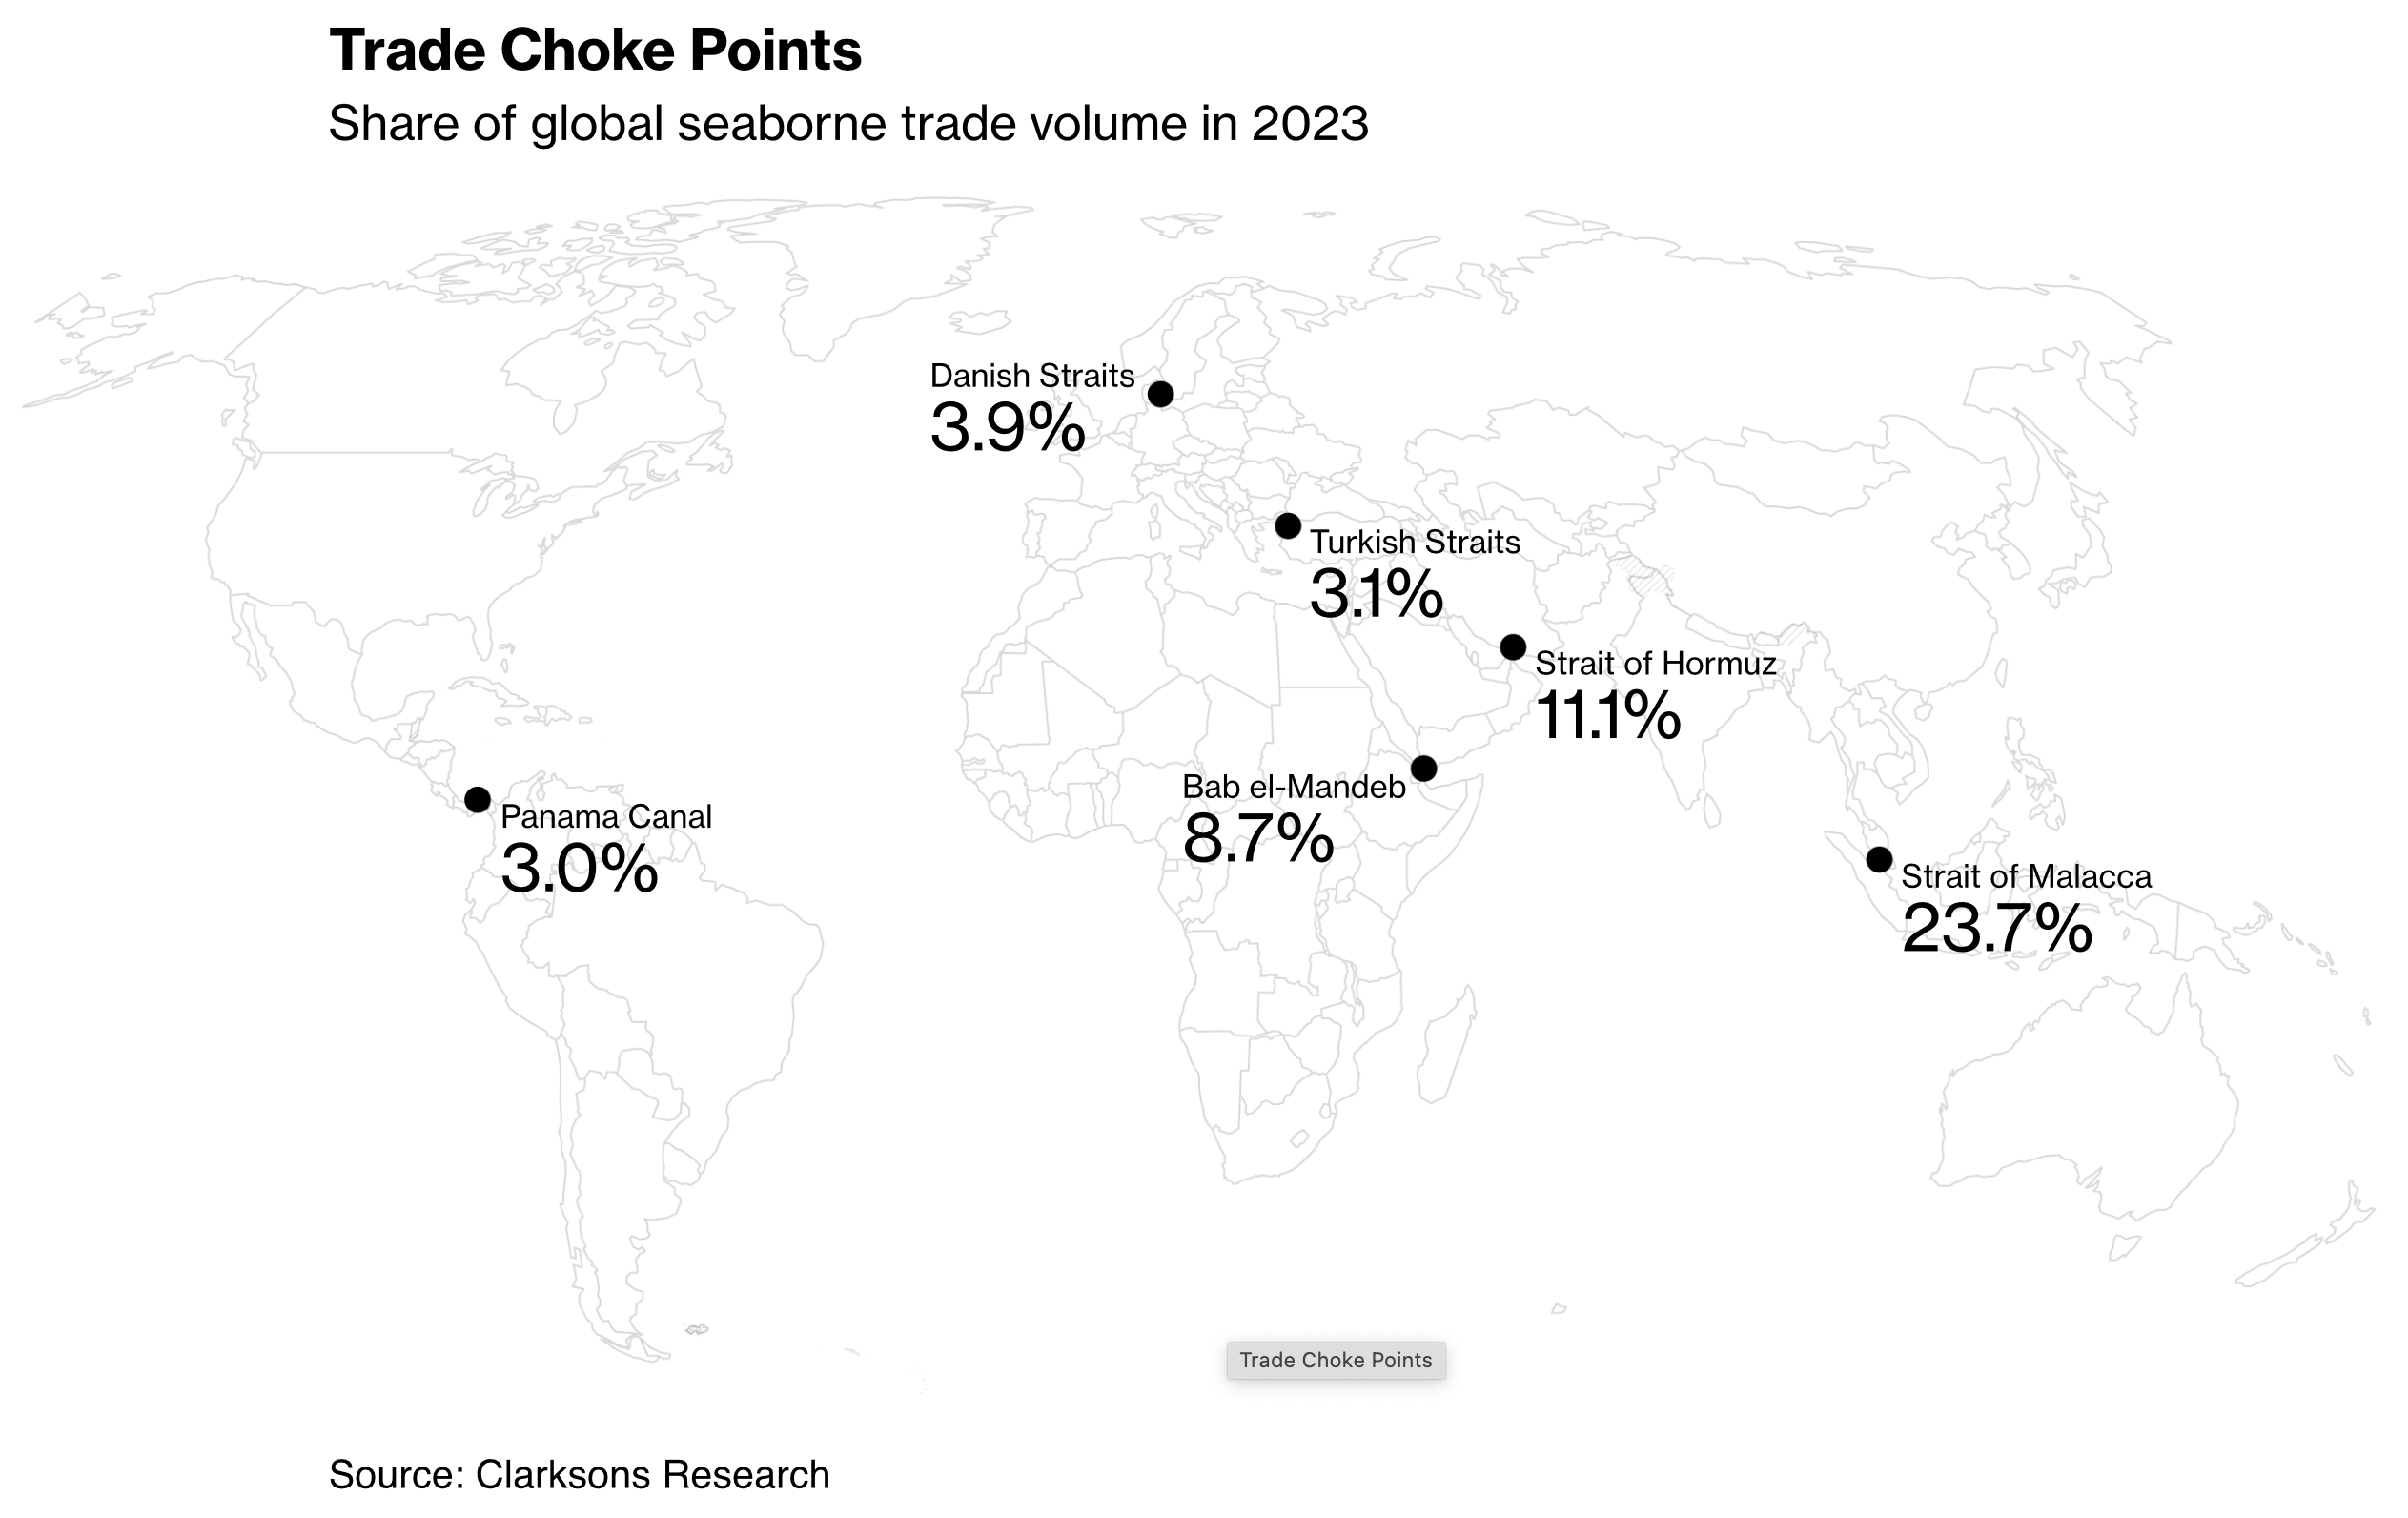
The Six Choke Points That Can Upend Global Trade – Bloomberg (May 23, 2024)
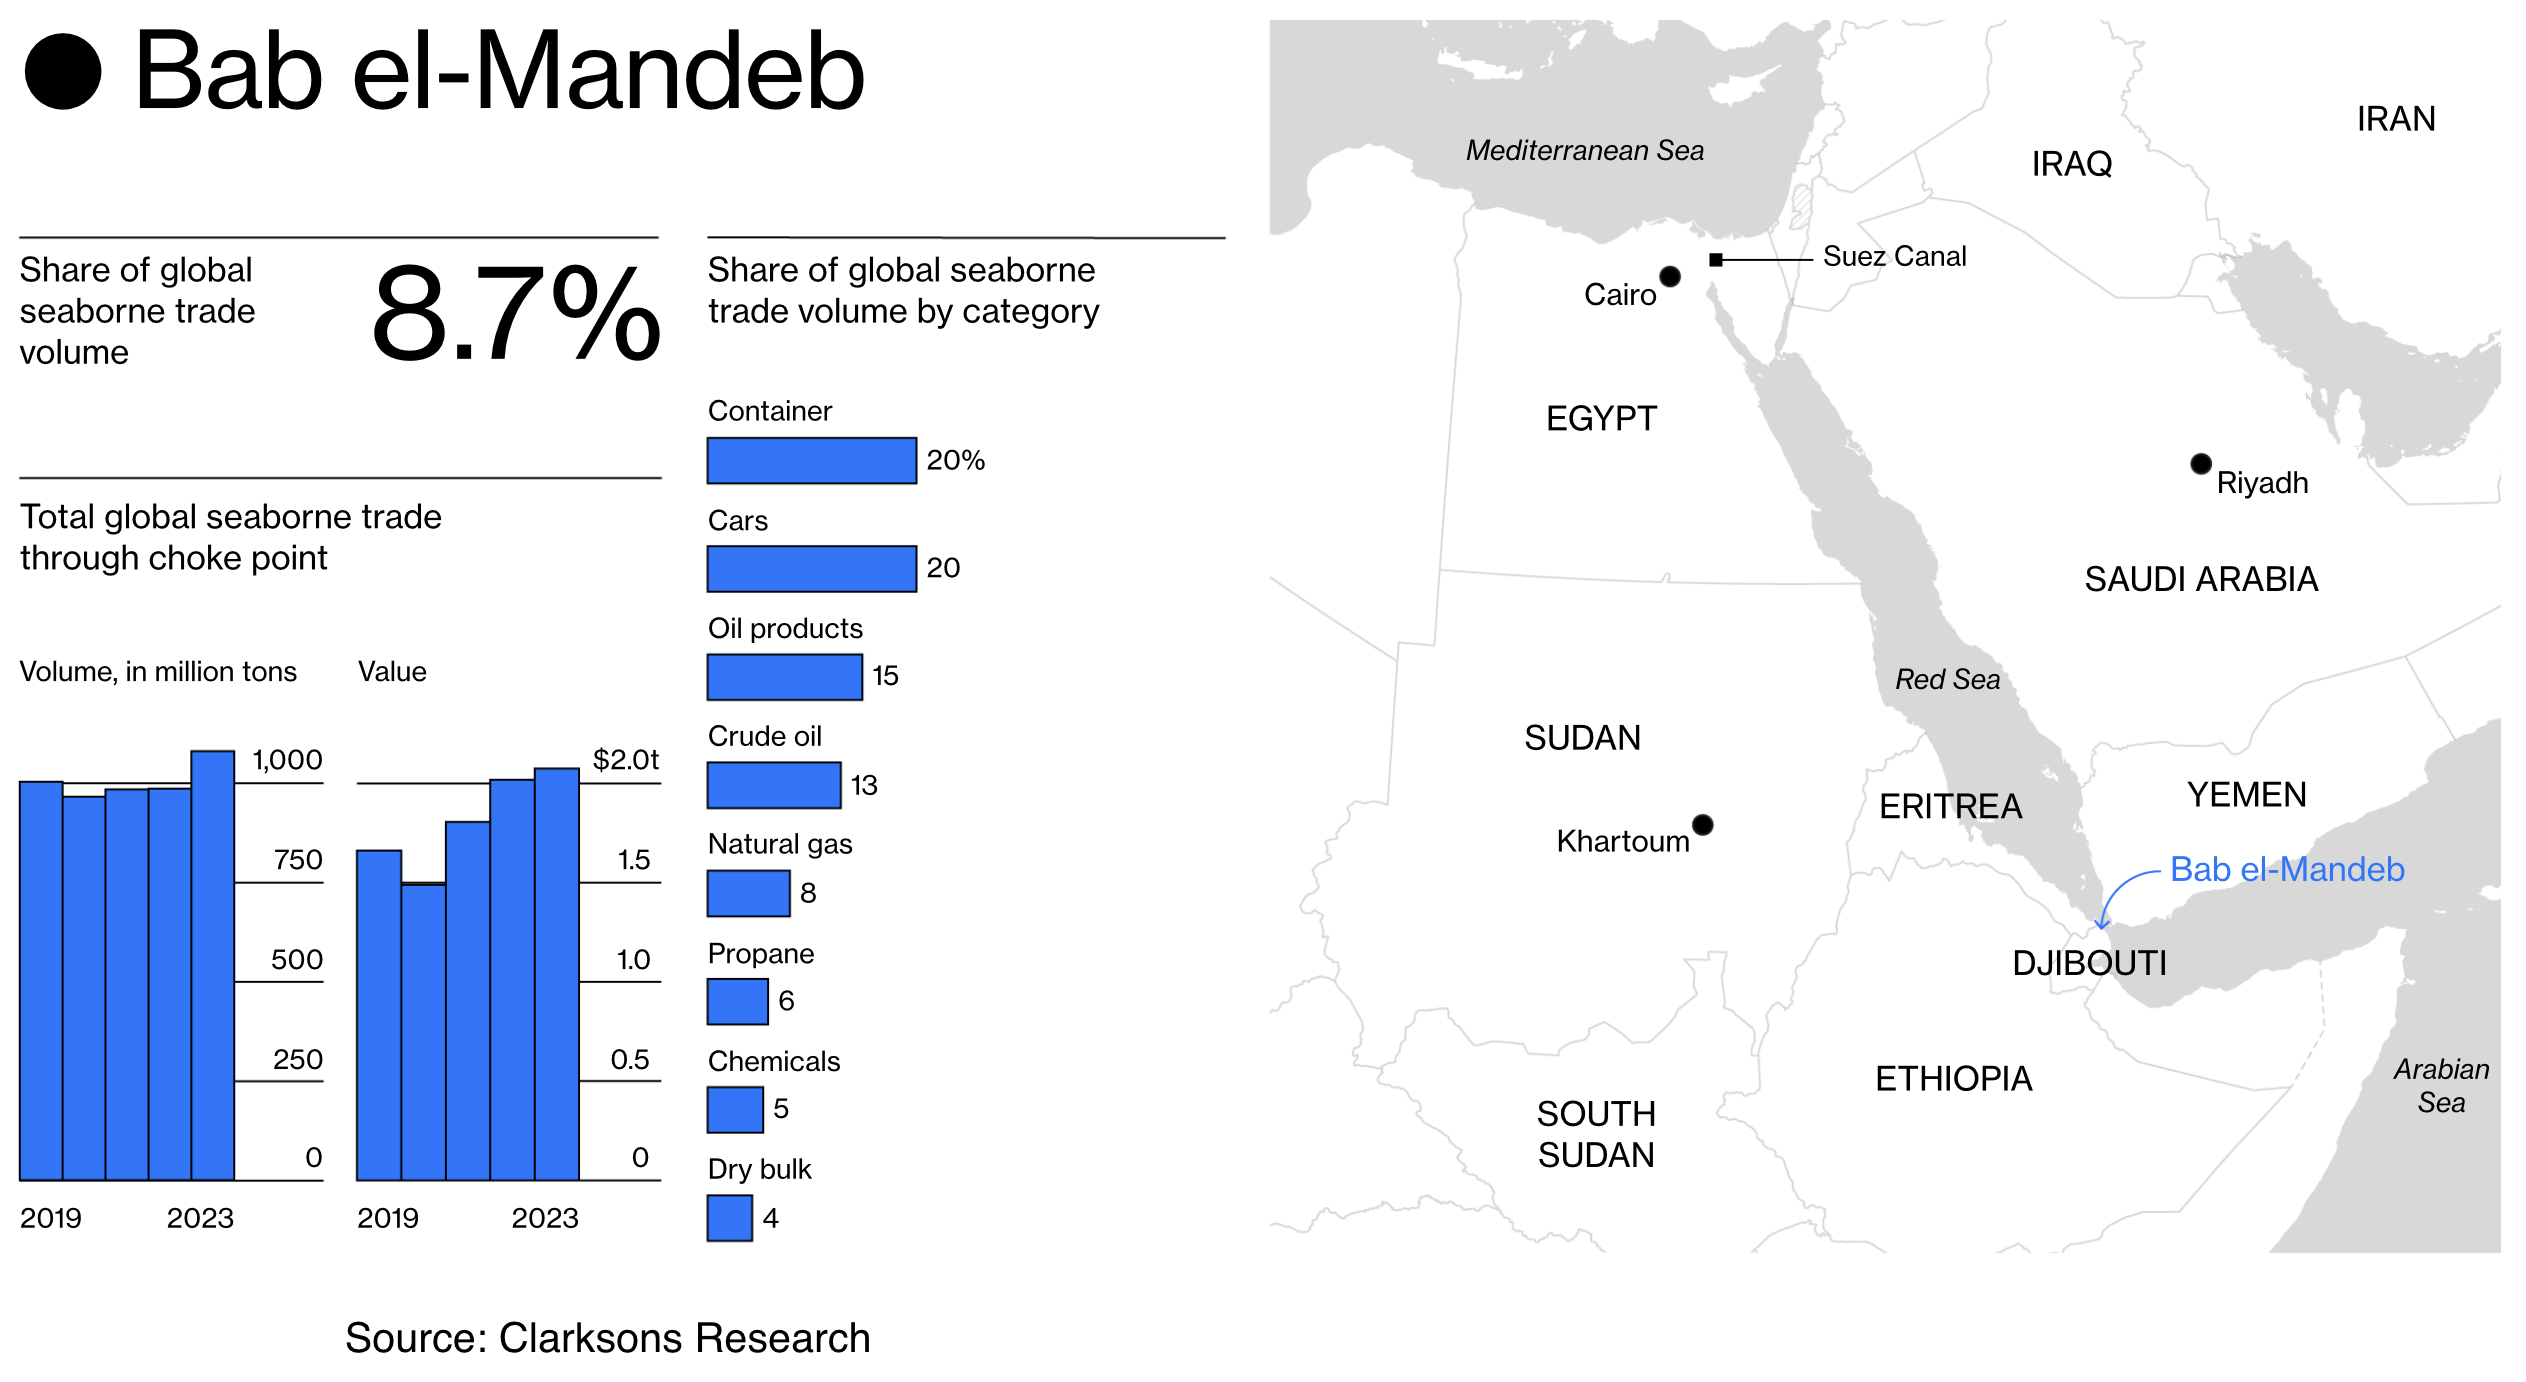
Different types of goods move through these chokepoints, transporting critical intermediate and final goods moving through global supply chains.
Many of these chokepoints lie on geopolitical fault lines, creating uncertainty for businesses relying on freight moving through them.
One such chokepoint is the Bab el-Mandeb strait between Yemen, Djibouti and Eritrea. It provides ships moving between South-East Asia and Europe access to the Suez Canal in the Red Sea, significantly reducing the distance (and time) between trading partners.
Recent geopolitical flair-ups have made this route untenable for maritime transportation with the Houthis attacking ships sailing through the strait. This has forced shipping companies to reroute their ships around Africa through the Cape of Good Hope, adding an average of ten days to a ship’s journey from Singapore to Rotterdam.
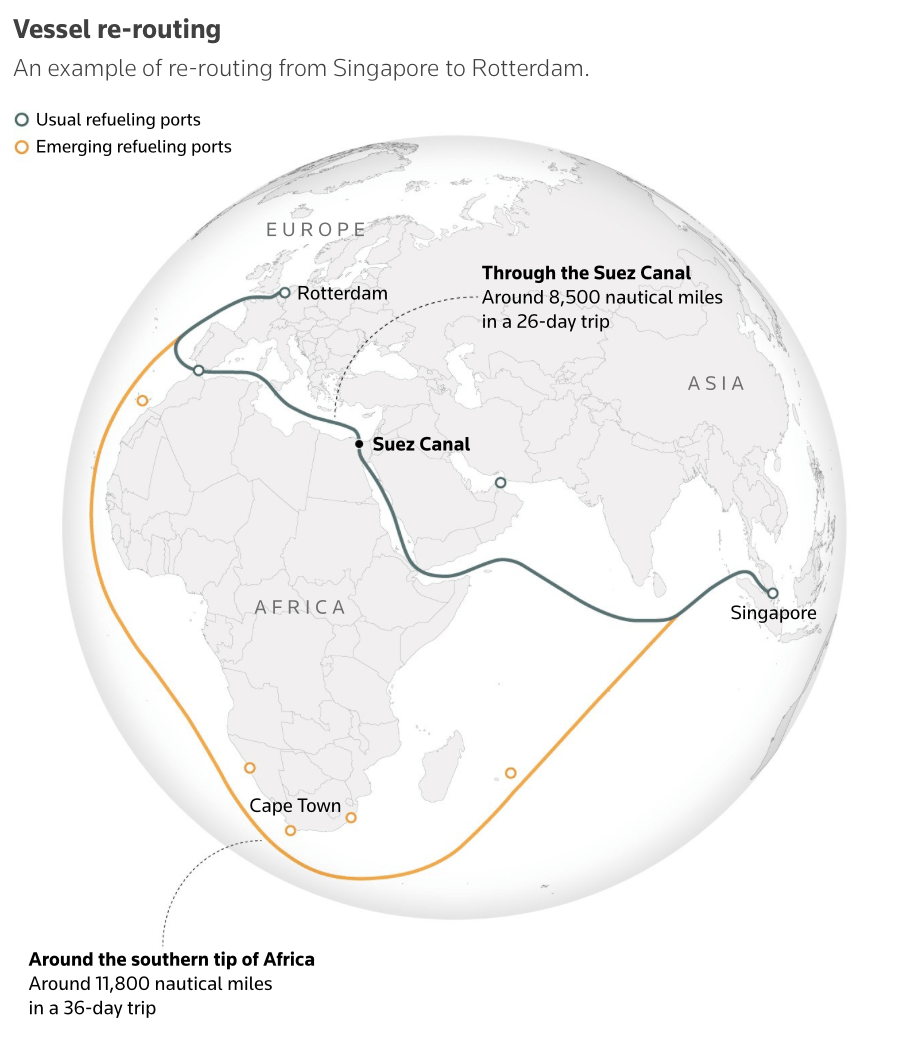
Red Sea attacks – Reuters (February 2, 2024)
Beyond the re-routing of ships through the Cape of Good Hope, new surface transportation routes through Saudi Arabia have also opened up. While this provides an alternative access to the Suez Canal, inter-modality adds complexity (and emissions) to this trade route.
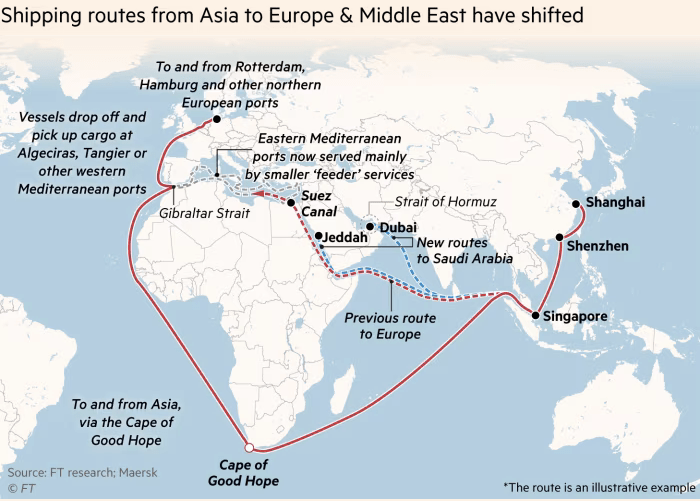
The mounting strains on global shipping – Financial Times (May 28, 2024)
Help us make this series even better! We would love to hear about sources we should follow to discover interesting projects and visualizations. Write to Bilal Siddika on LinkedIn or via email.