About
About us
Sustainable development
People
Partners
Research
Topics
Publications
Insights
Events
SLGL dataHub
Digital twin
Getting started
*
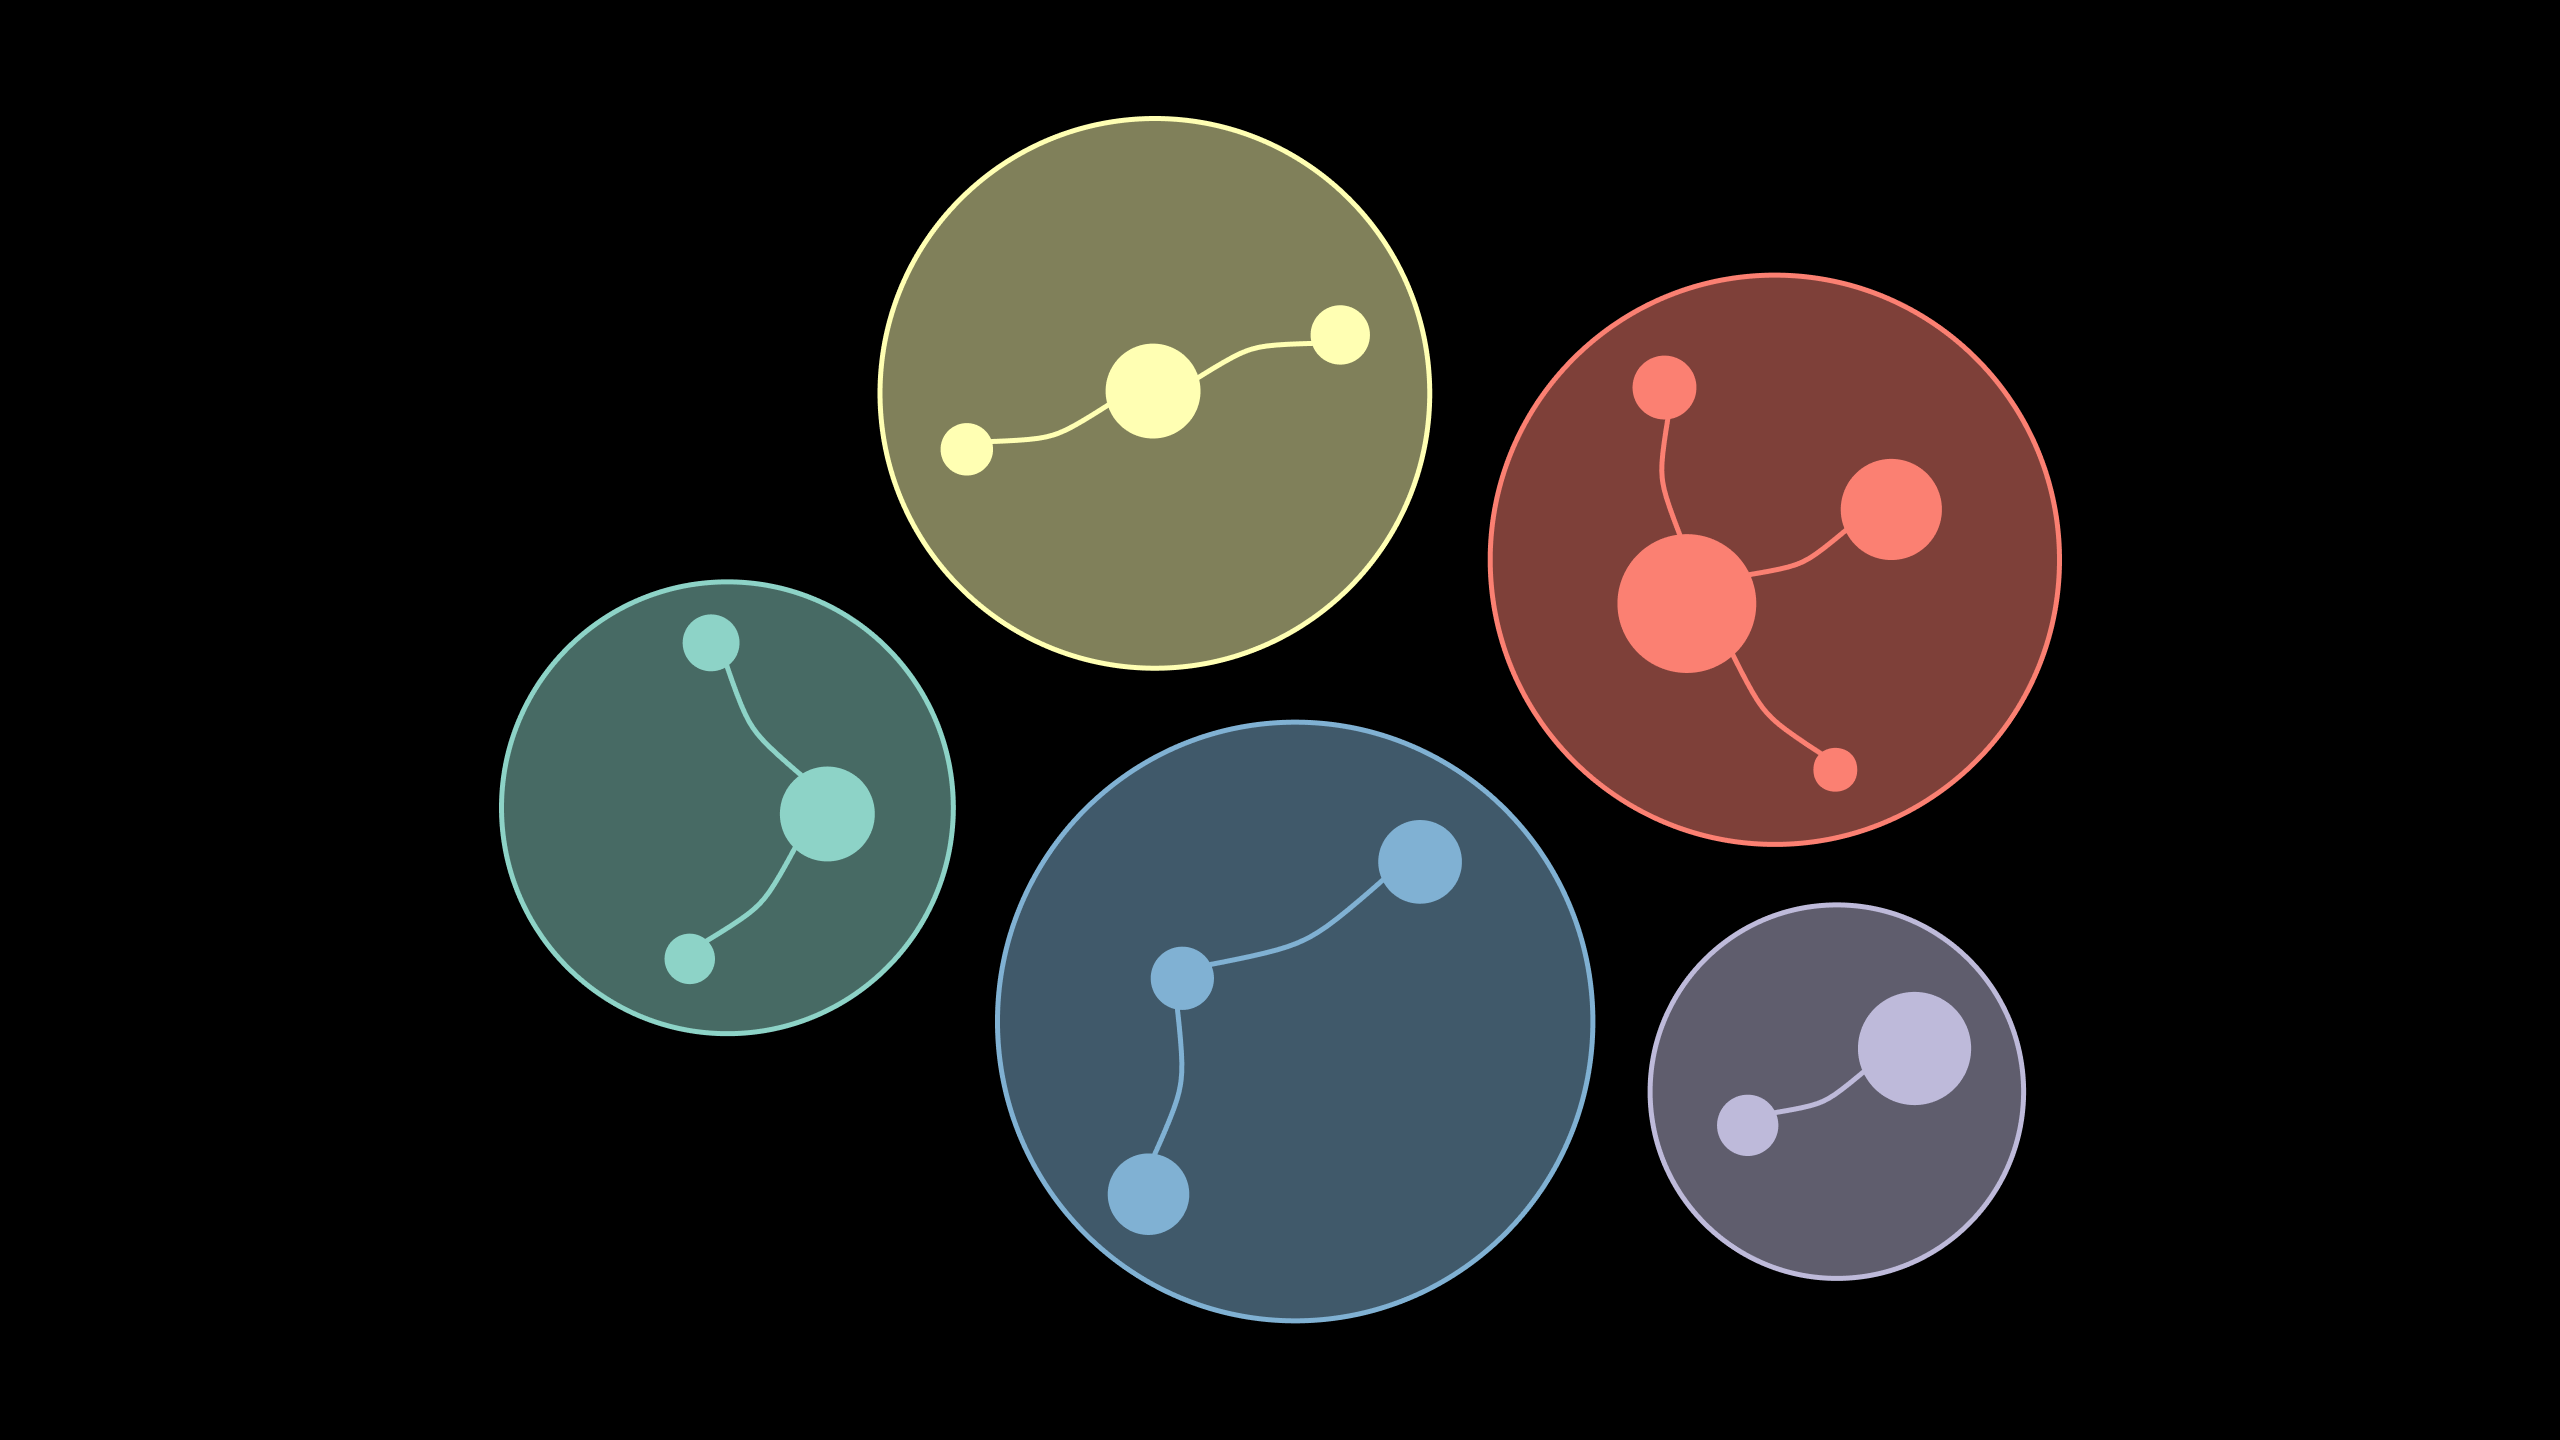
Economic Clusters
Measuring Competitiveness in the Great Lakes-St. Lawrence Region Using a Digital Twin: A Geospatial Data Science Approach
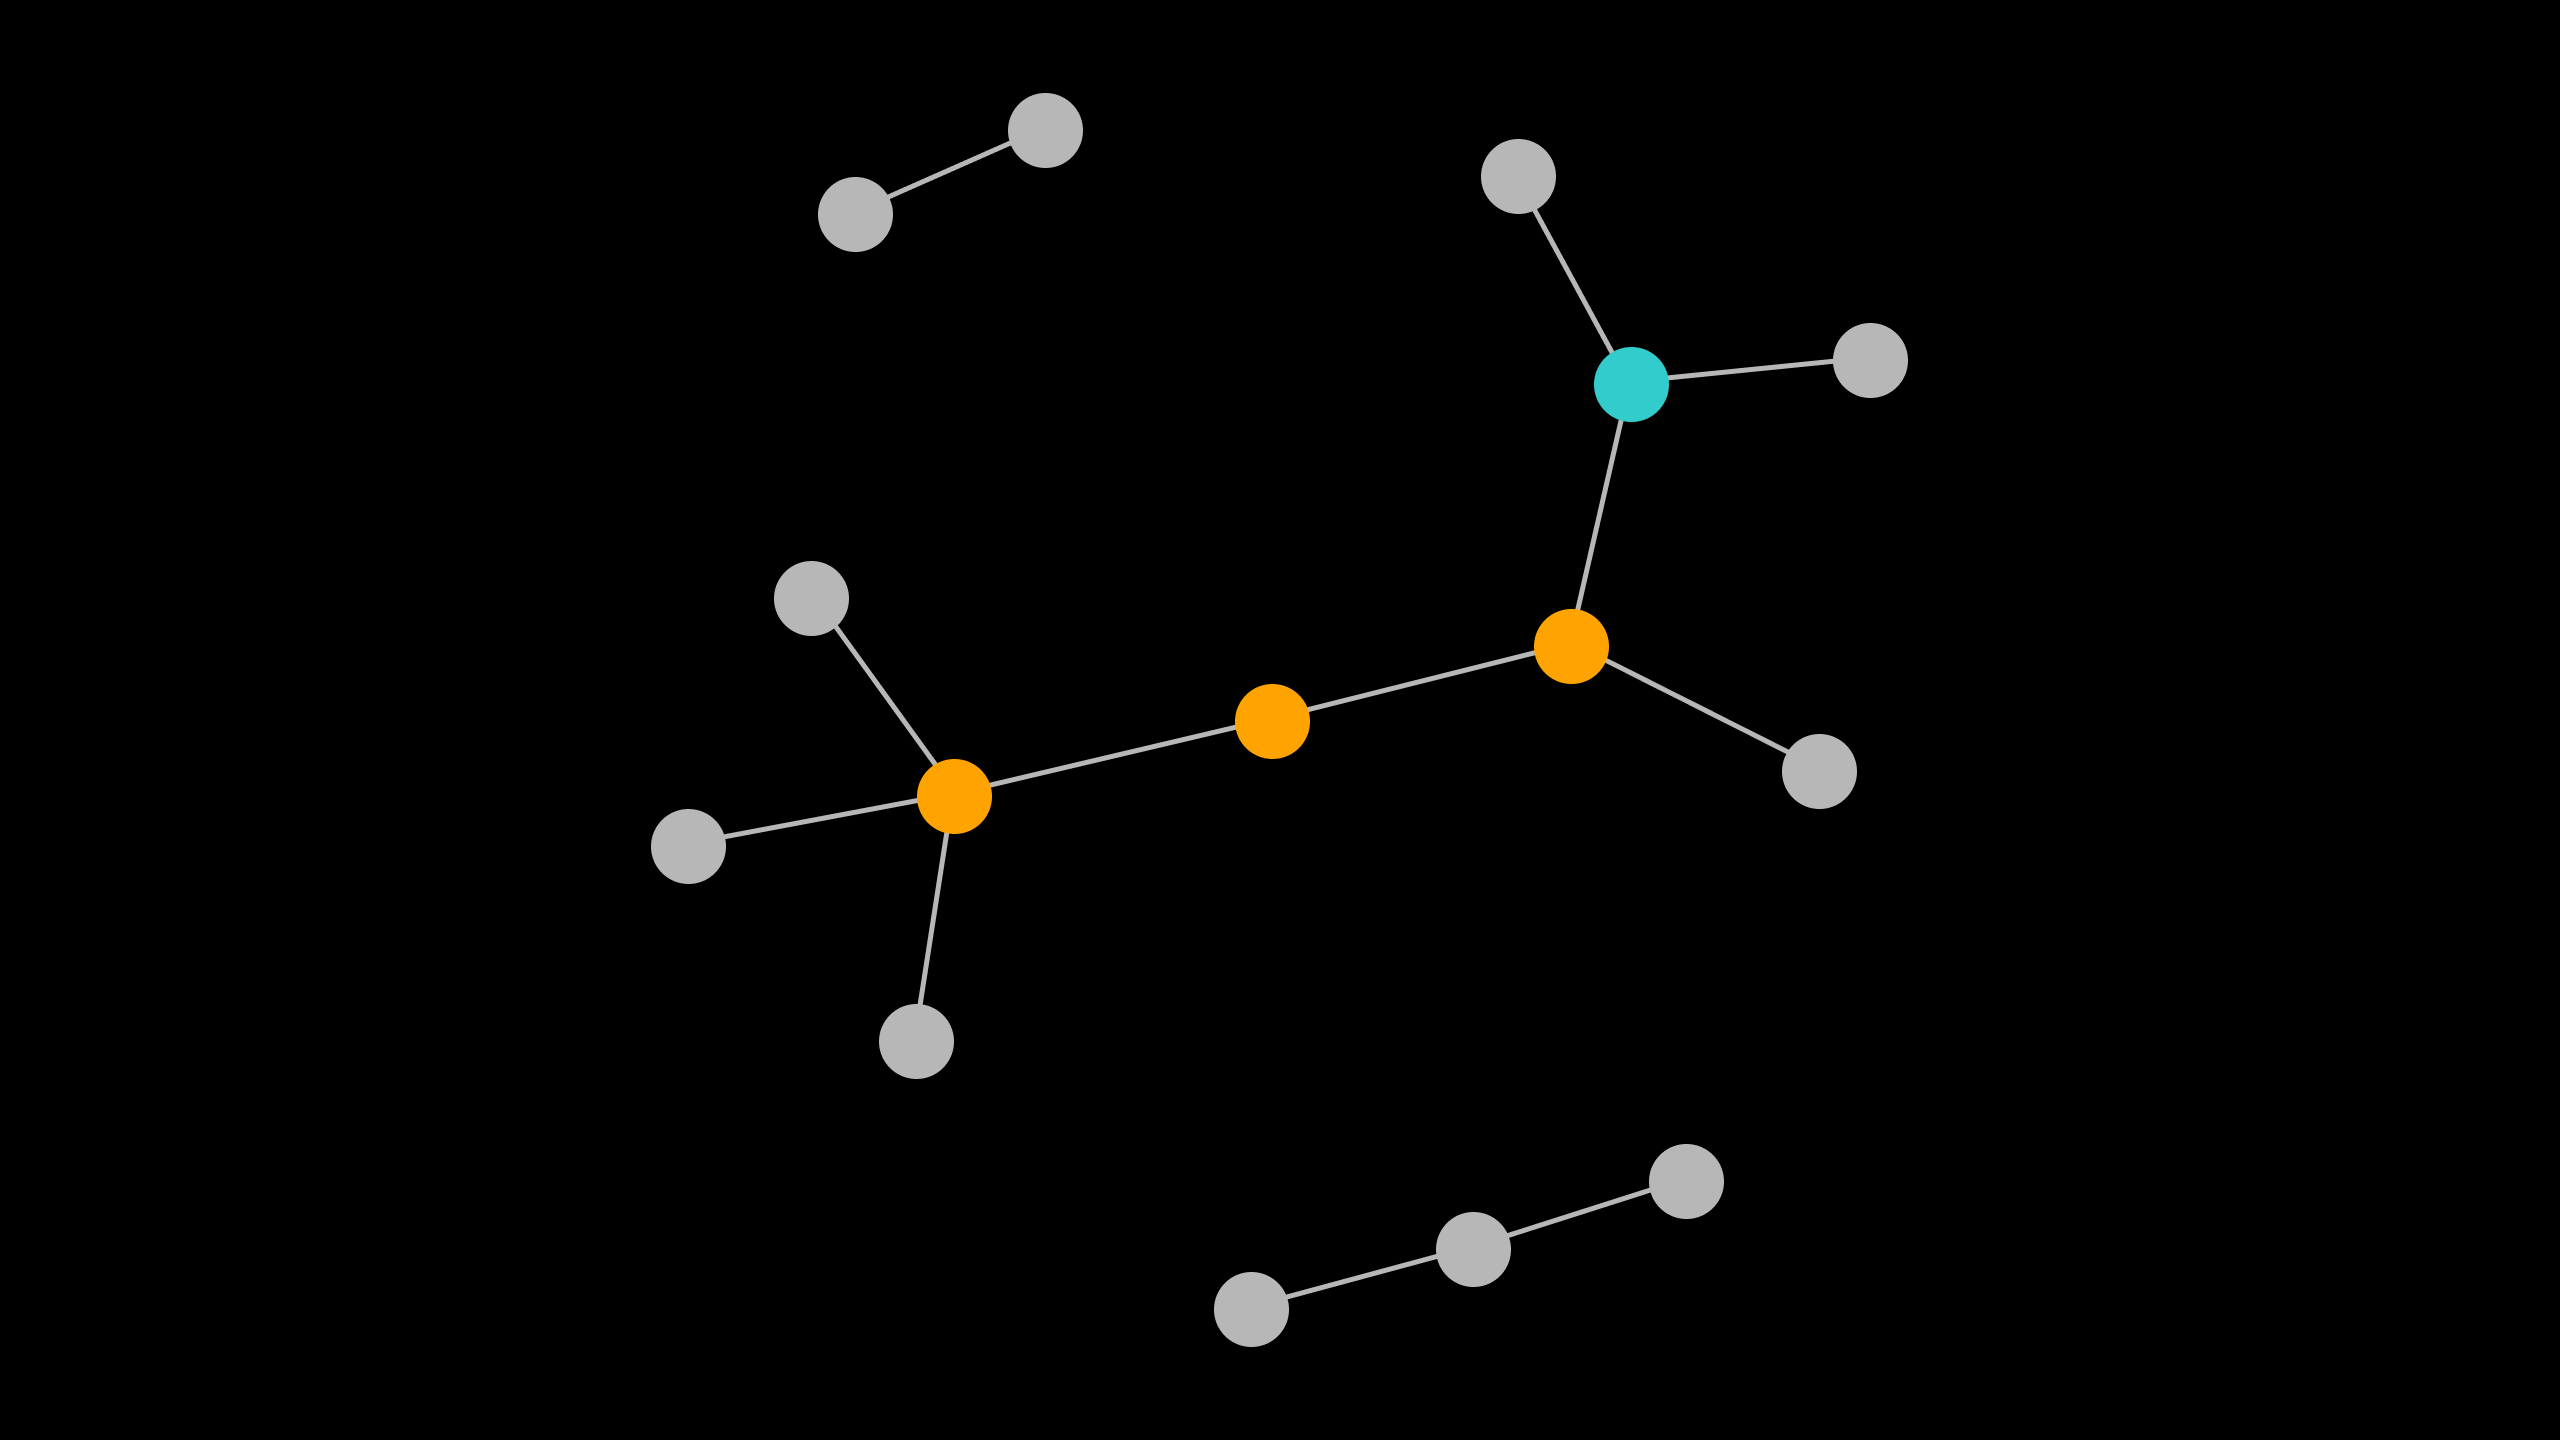
Identifying clusters in Québec with machine learning
A machine learning approach for identifying clusters in real-time
Exploring Quebec’s aerospace industry
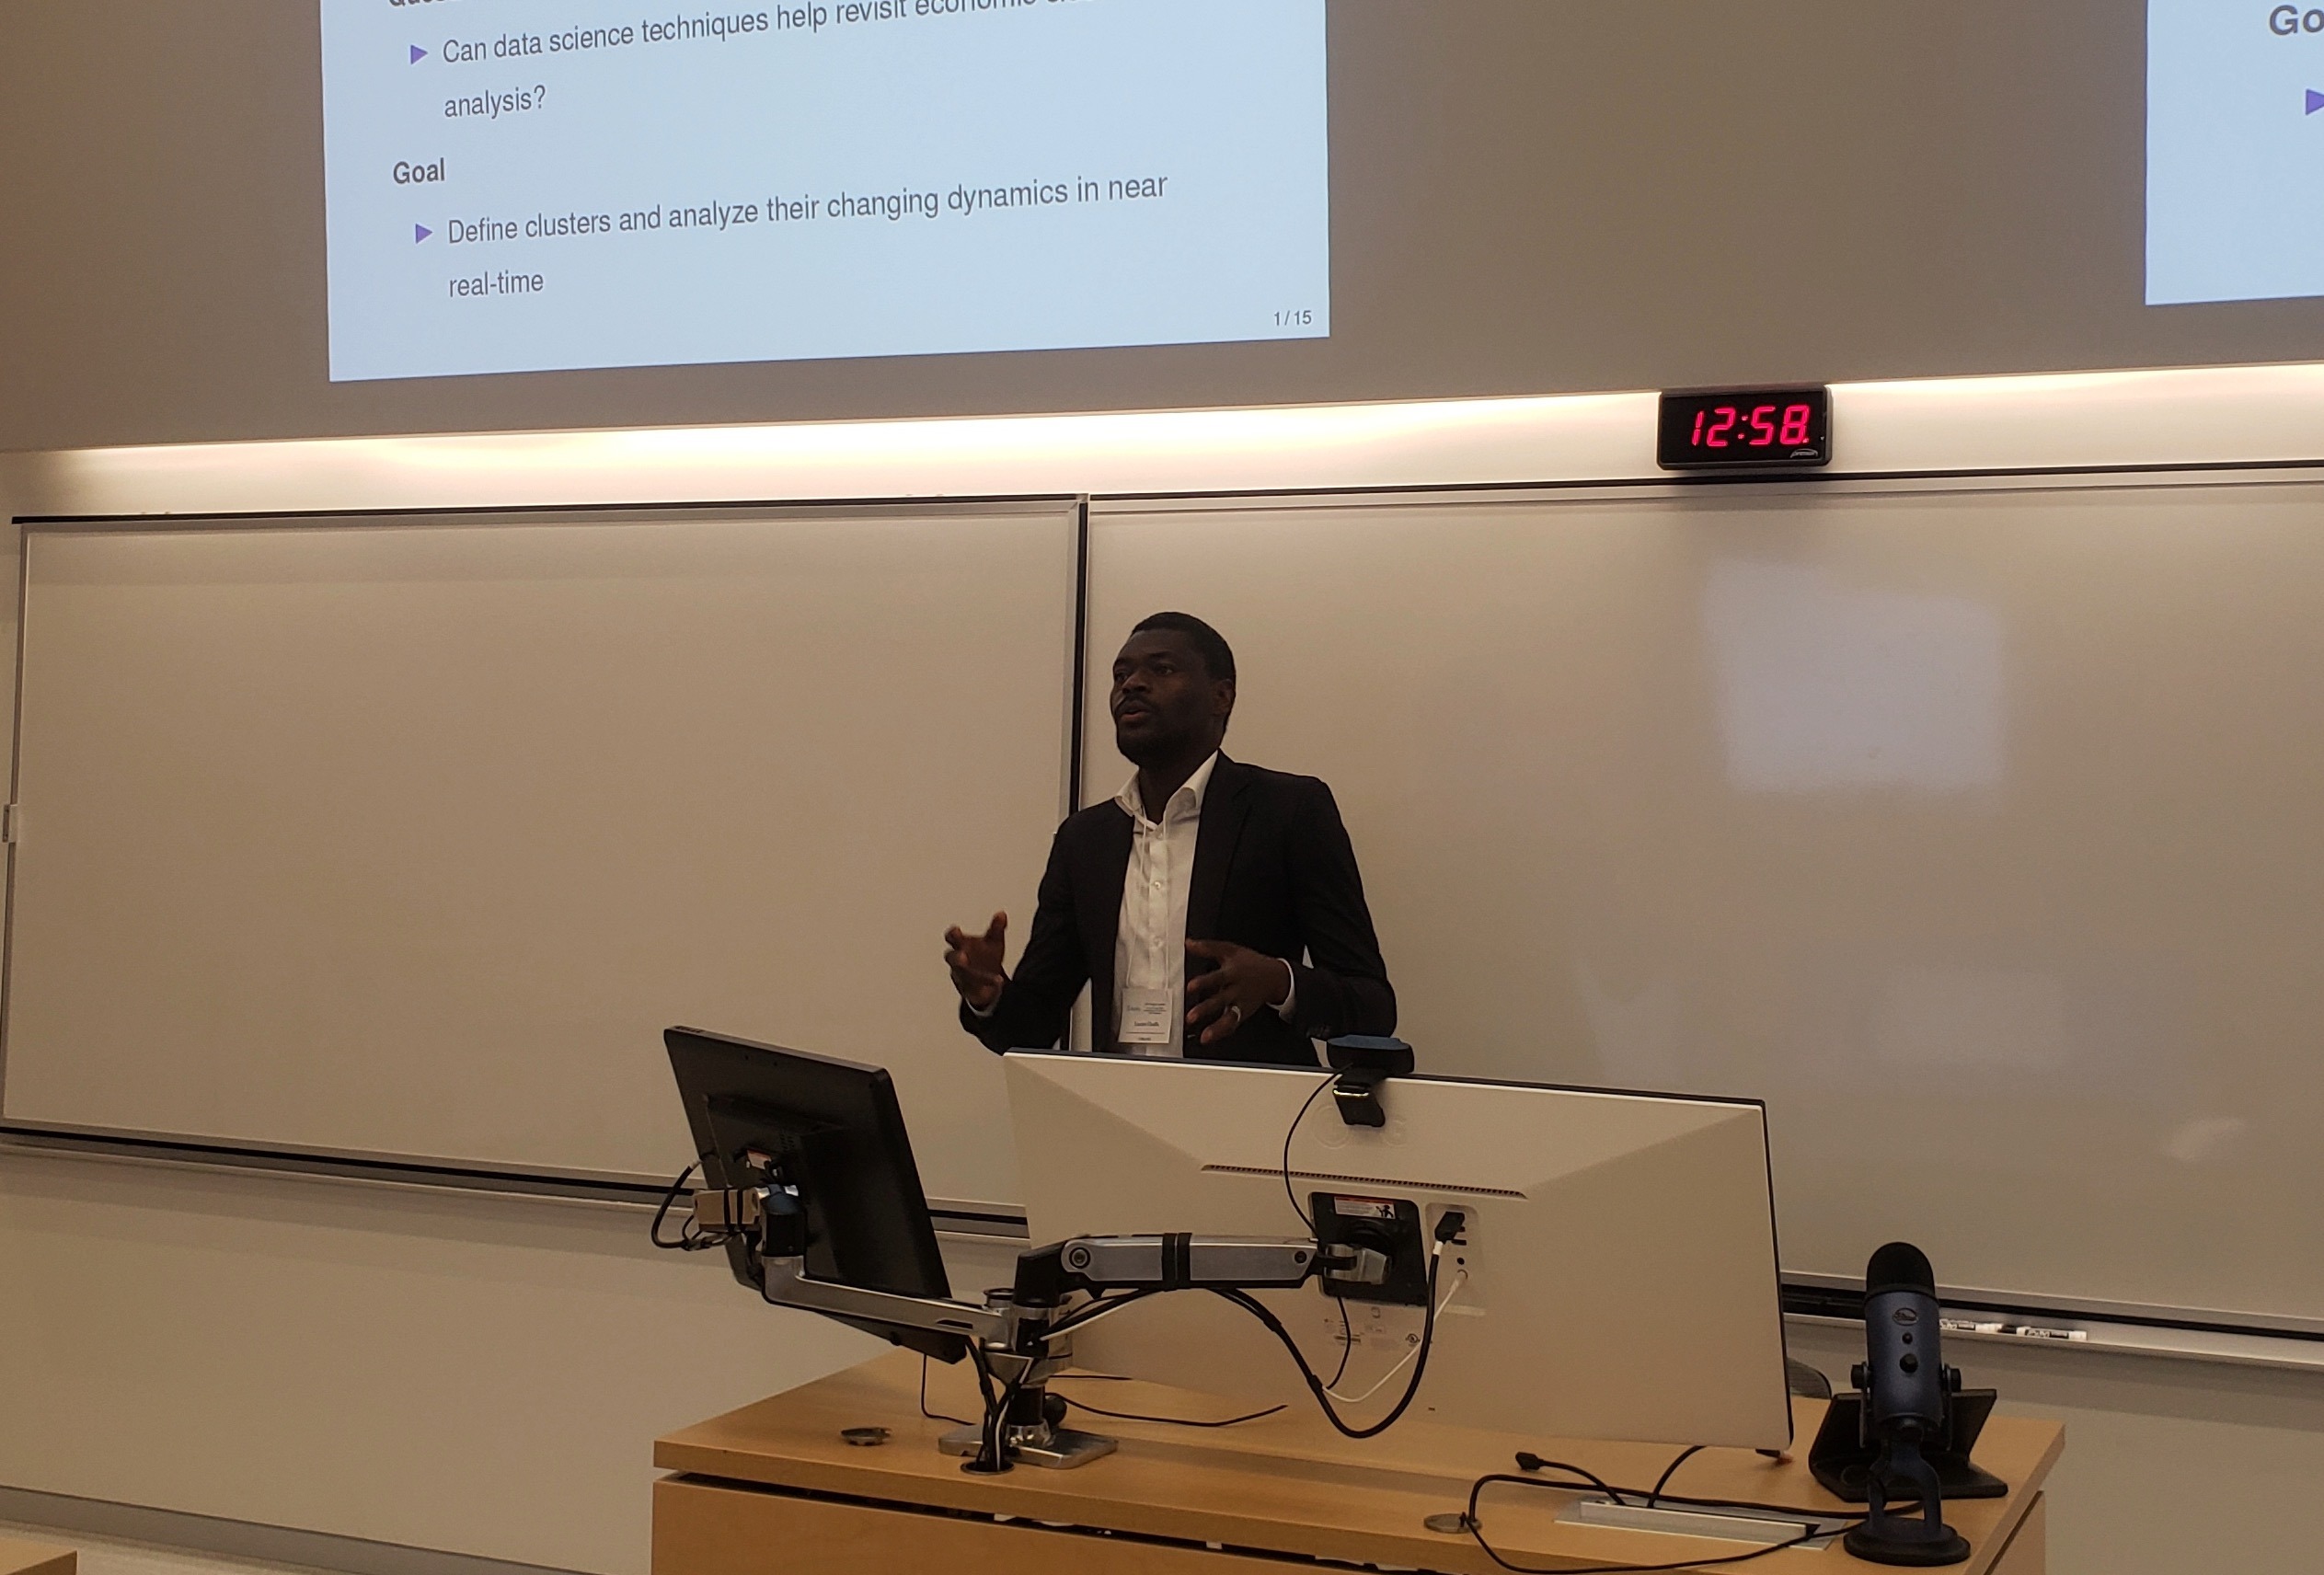
Lucien Chaffa presents at the 63rd annual conference of the SCSE
Next Page
→
FR
FR