About
About us
Sustainable development
People
Partners
Research
Topics
Publications
Insights
Events
SLGL dataHub
Digital twin
Getting started
*
Bilal Siddika
Data Vizdom: Blockchain for supply chains
Data Vizdom: Foreign Direct Investment
Data Vizdom: Creator economy
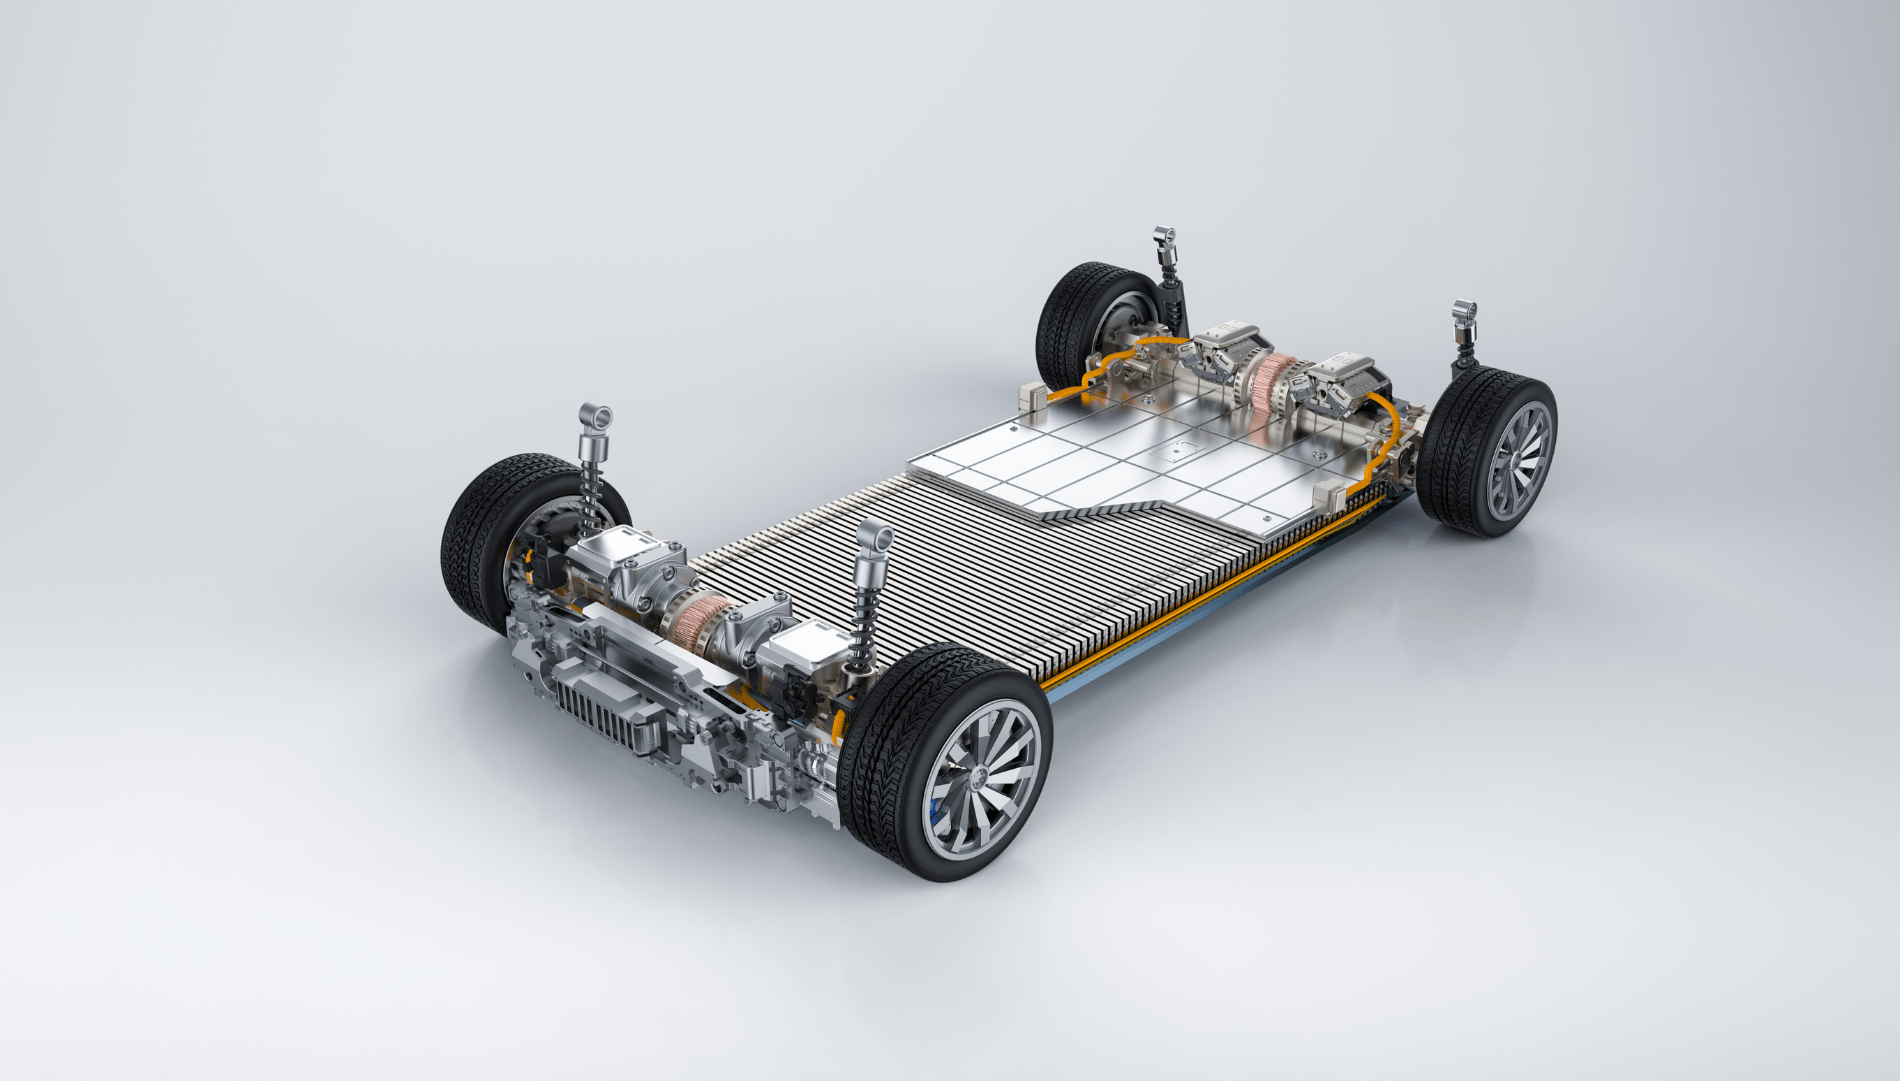
Batteries for EVs: Investing in Canada’s Prospects
Data Vizdom: Free Trade Agreements
←
Previous Page
Next Page
→
FR
FR