About
About us
Sustainable development
People
Partners
Research
Topics
Publications
Insights
Events
SLGL dataHub
Digital twin
Getting started
*
Bilal Siddika
Data Vizdom: Red Sea crisis
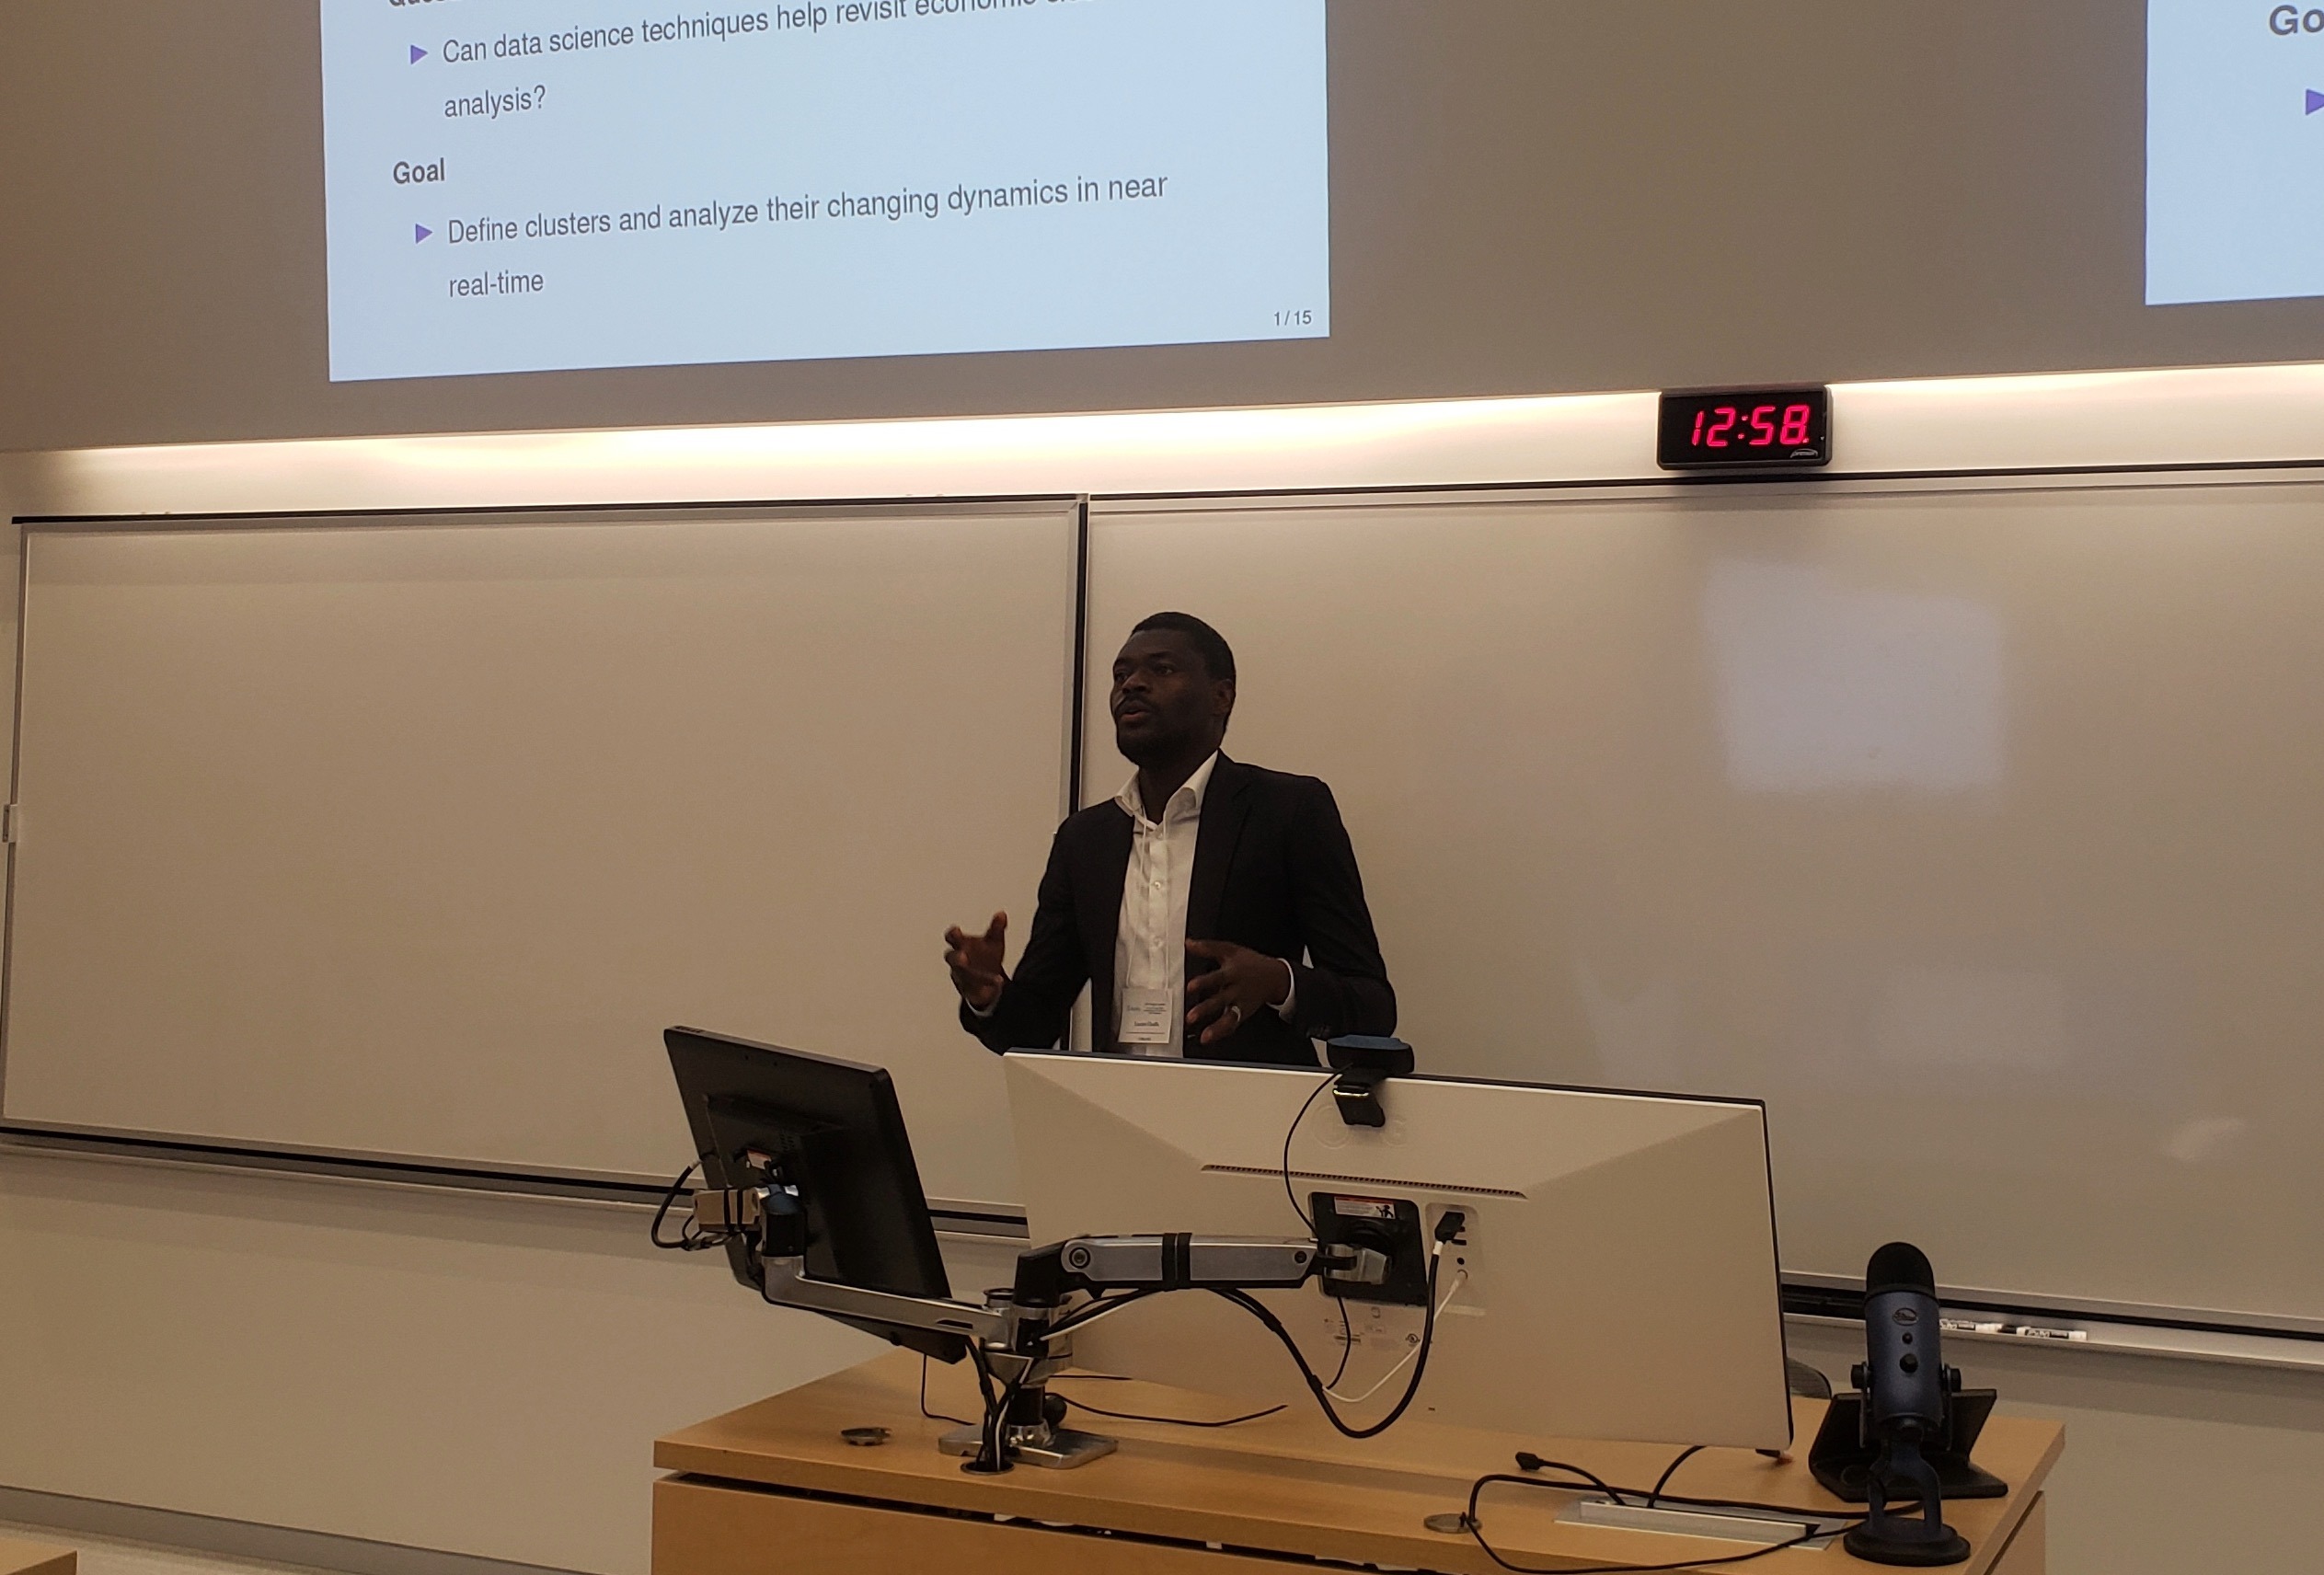
Lucien Chaffa presents at the 63rd annual conference of the SCSE
Introducing the SLGL dataHub
Breaking down Quebec’s industry life cycles
Input-output tables: The foundational bricks of the SLGL dataHub
←
Previous Page
Next Page
→
FR
FR