While several Canadian ports operate container terminals, five handle the bulk of ocean-going container traffic. As shipping consolidates around larger vessels, these terminals have undergone significant infrastructure upgrades to accommodate the shift.
On the eastern side, PSA Halifax has new cranes capable of handling the world’s largest vessels, carrying over 20,000 twenty-foot equivalent units (TEUs). The Port of Saint John also has upgrades that accommodate New Panamax ships of up to 14,000 TEUs. By contrast, the Port of Montréal is constrained by navigational limits of the St. Lawrence, restricting access to Post-Panamax vessels of roughly 6,500 TEUs.
Ultimately, container traffic through these terminals depends on shipping lines choosing to call, driven by business demand as well as cost and time competitiveness. To attract and sustain these services, ports must provide strong inland connectivity, enabling quick cargo turnaround to reach different market segments via road and rail options.
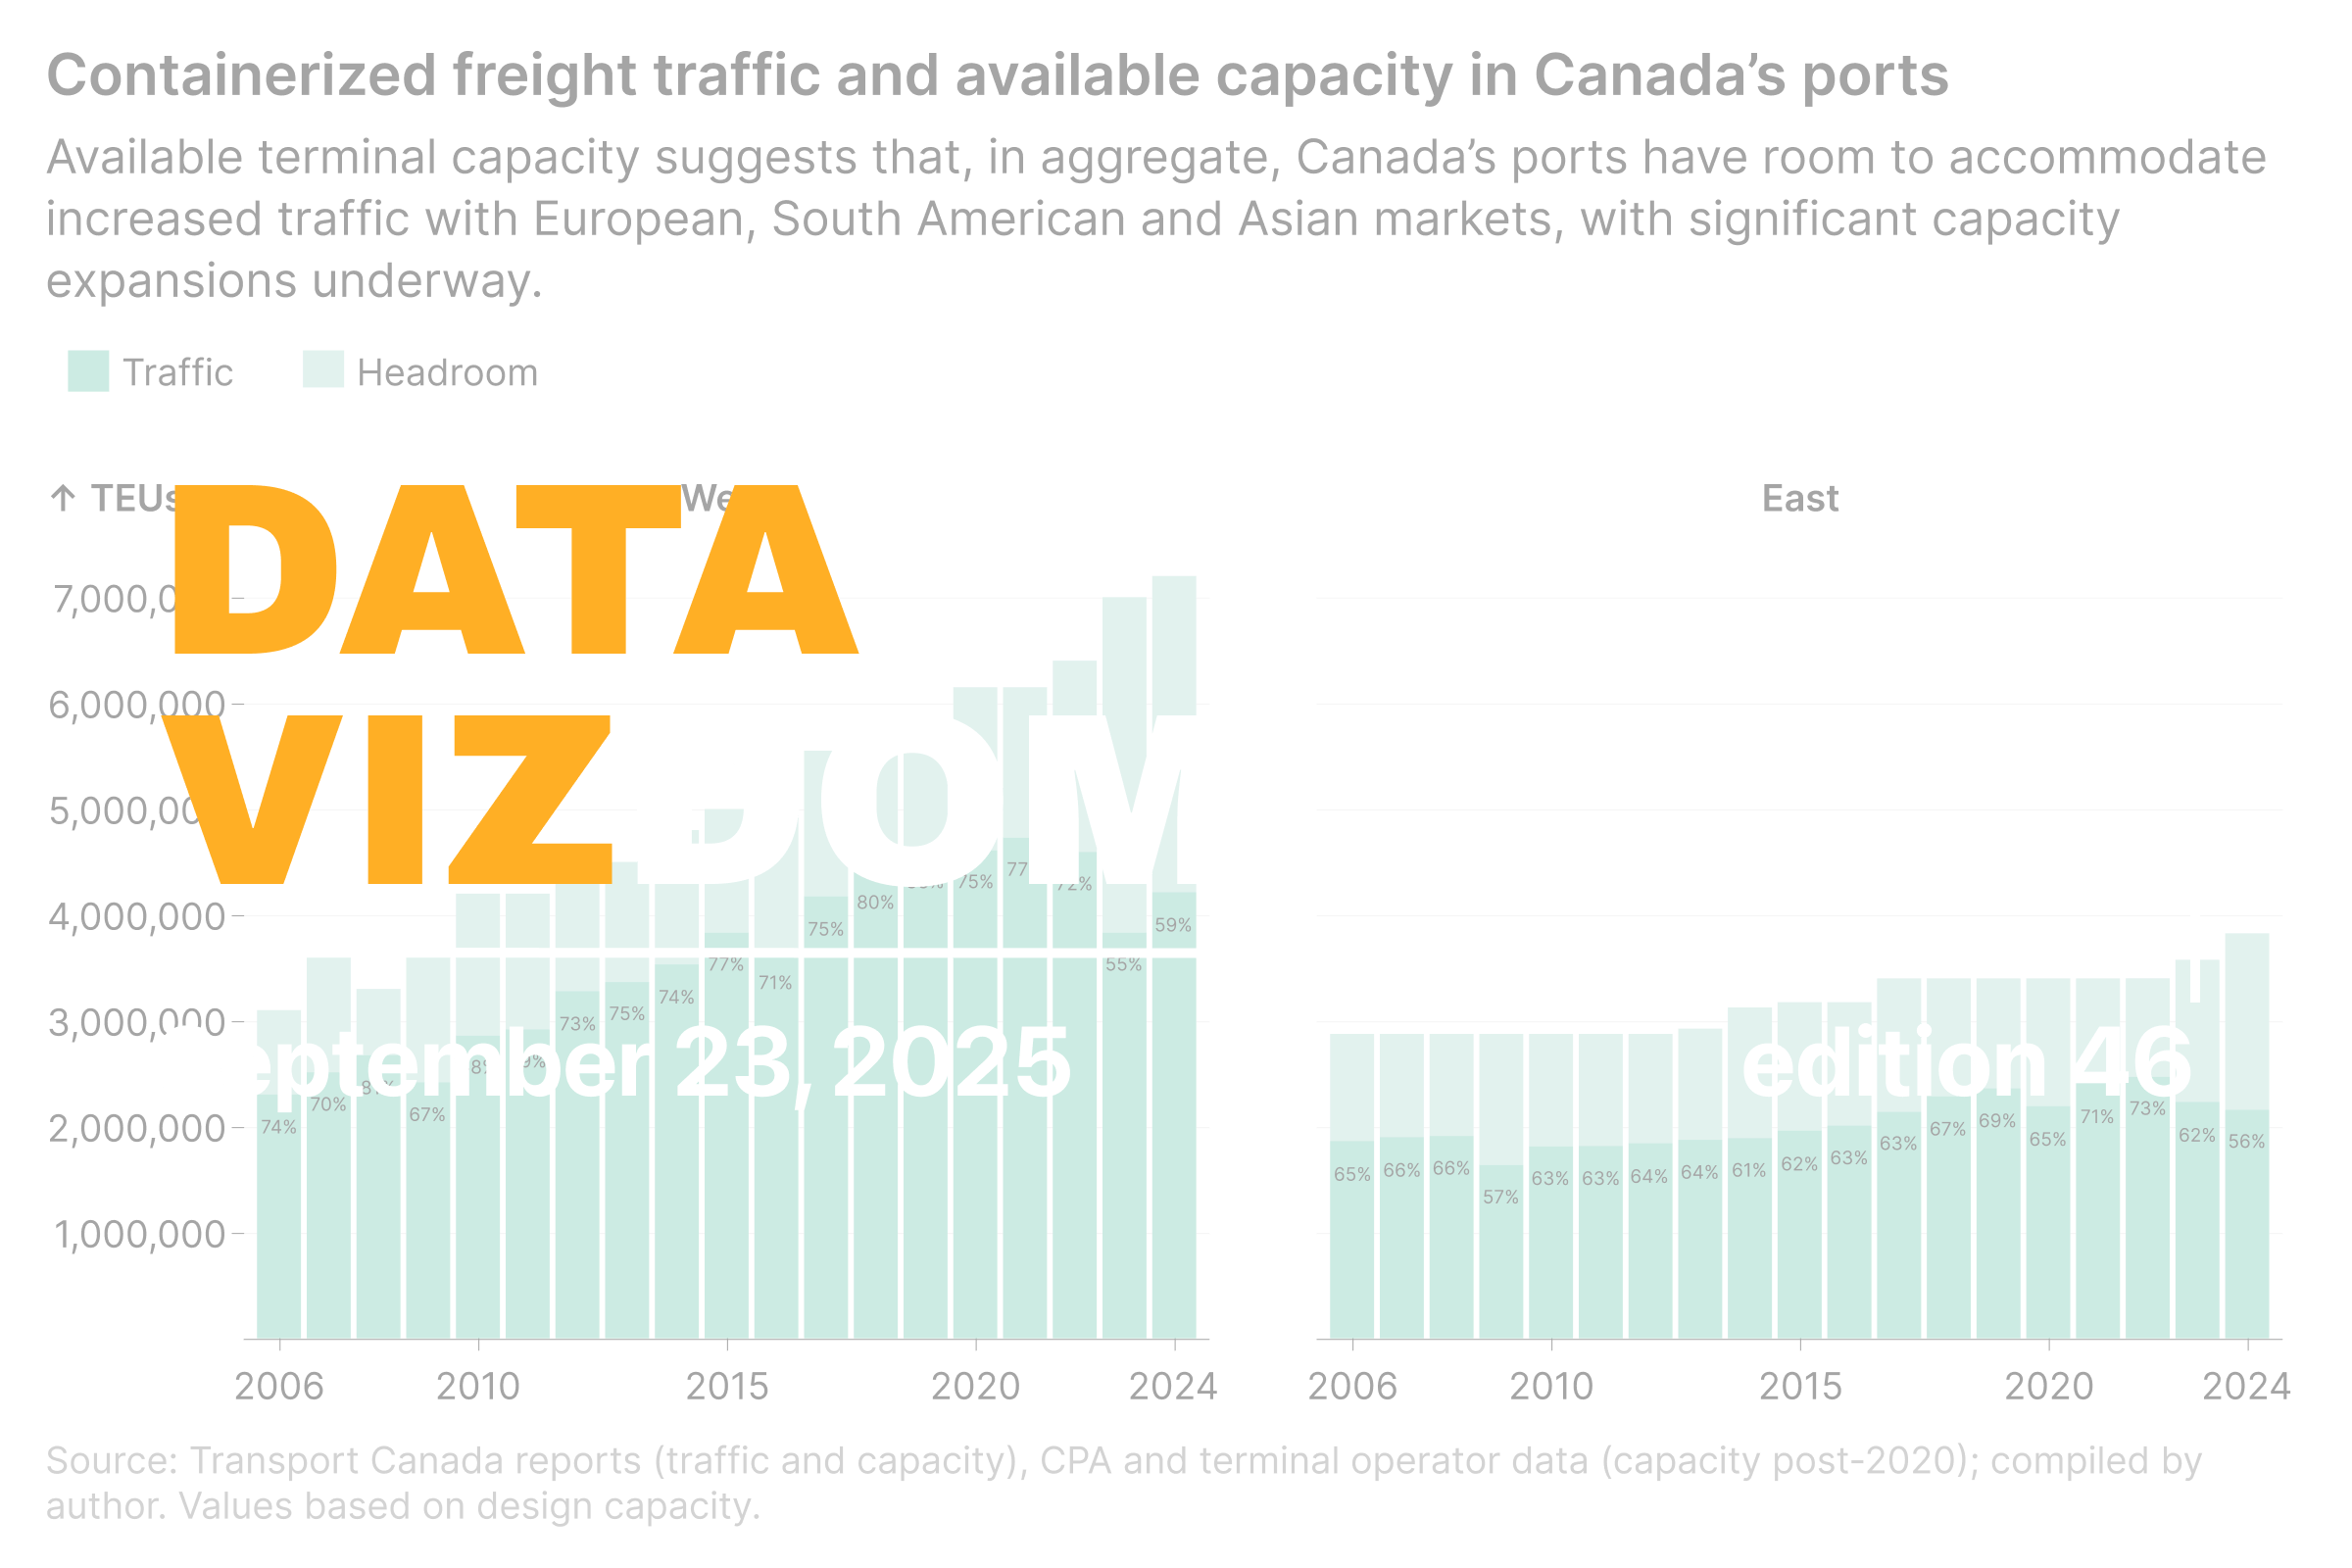
With this context, the chart below shows aggregate container traffic and terminal capacity at the western ports of Vancouver and Prince Rupert, and the eastern ports of Montreal, Halifax and Saint John since 2006. Design capacity of the terminals has been used, as effective capacity can vary due to operational factors.
Overall container capacity and traffic at the western ports have grown much faster, reaching over 7 million TEUs in capacity and 4.2 million TEUs in traffic, up from 3.1 and 2.3 million TEUs in 2006. In 2024, due to both new capacity and a decline in traffic, utilization was only 59%. The Port of Prince Rupert, which began operations in 2007, quickly grew in importance by offering the shortest Pacific route to Asia. Its capacity reached 1.8 million TEUs in 2024, though traffic has declined since 2022.
Eastern ports have seen more modest growth, from roughly 2.9 million TEUs in capacity and 1.8 million TEUs in traffic in 2012 to 3.8 and 2.1 million TEUs in 2024. A decline in traffic at the Port of Montréal since 2019 and large excess capacity at Halifax keep utilization at just 56%. Ongoing investments, including 1.15 million TEUs at the Port of Montreal’s Contrecoeur terminal and 0.5 million TEUs at Saint John, will further strengthen capacity for ongoing trade diversification efforts.
For context, the Port of Savannah handled 5.5 million TEUs in 2024 with a capacity of about 6 million TEUs, yielding roughly 90% utilization, soon to rise to 9.5 million TEUs with planned expansions. Singapore, the world’s second-largest container port, handled 41.1 million TEUs with a capacity of 43.9 million TEUs, or around 94% utilization.
Thus, while large infrastructure projects are set to add significant new capacity in the years ahead, ports can also capture gains in the shorter term through operational improvements such as faster turnaround and stronger inland connectivity. Together, these approaches will help Canadian ports make the most of their investments as the post-COVID slowdown in traffic gradually reverses.
Data Vizdom digs into ideas big and small through visualizations that help make sense of a changing world, drawing on data from the SLGL dataHub.