Statistics Canada’s latest trade report (June 2025) hints at a turning point. After recording their steepest monthly drop in five years, to $60 billion in April, exports have stopped falling and inched upward. Much of June’s rebound is tied to the U.S., where shipments have picked up again in value terms.
At the aggregate level, the rise, fall, and rebound could reflect inventory cycles. One possible explanation is that firms which stocked up earlier in the year have drawn down their supplies and are now replenishing them. As tariff conditions for CUSMA-compliant goods remain unchanged, apart from targeted measures like those on aluminum, U.S. firms would continue buying from Canadian suppliers.
As not every sector moves in sync, looking at individual commodities can provide more clues. By comparing monthly value and volume data, we can see whether the strong export numbers in the first quarter reflect front-loading through higher volumes. The charts below show how Canada’s top exports are performing, both to the U.S. and to the rest of the world.
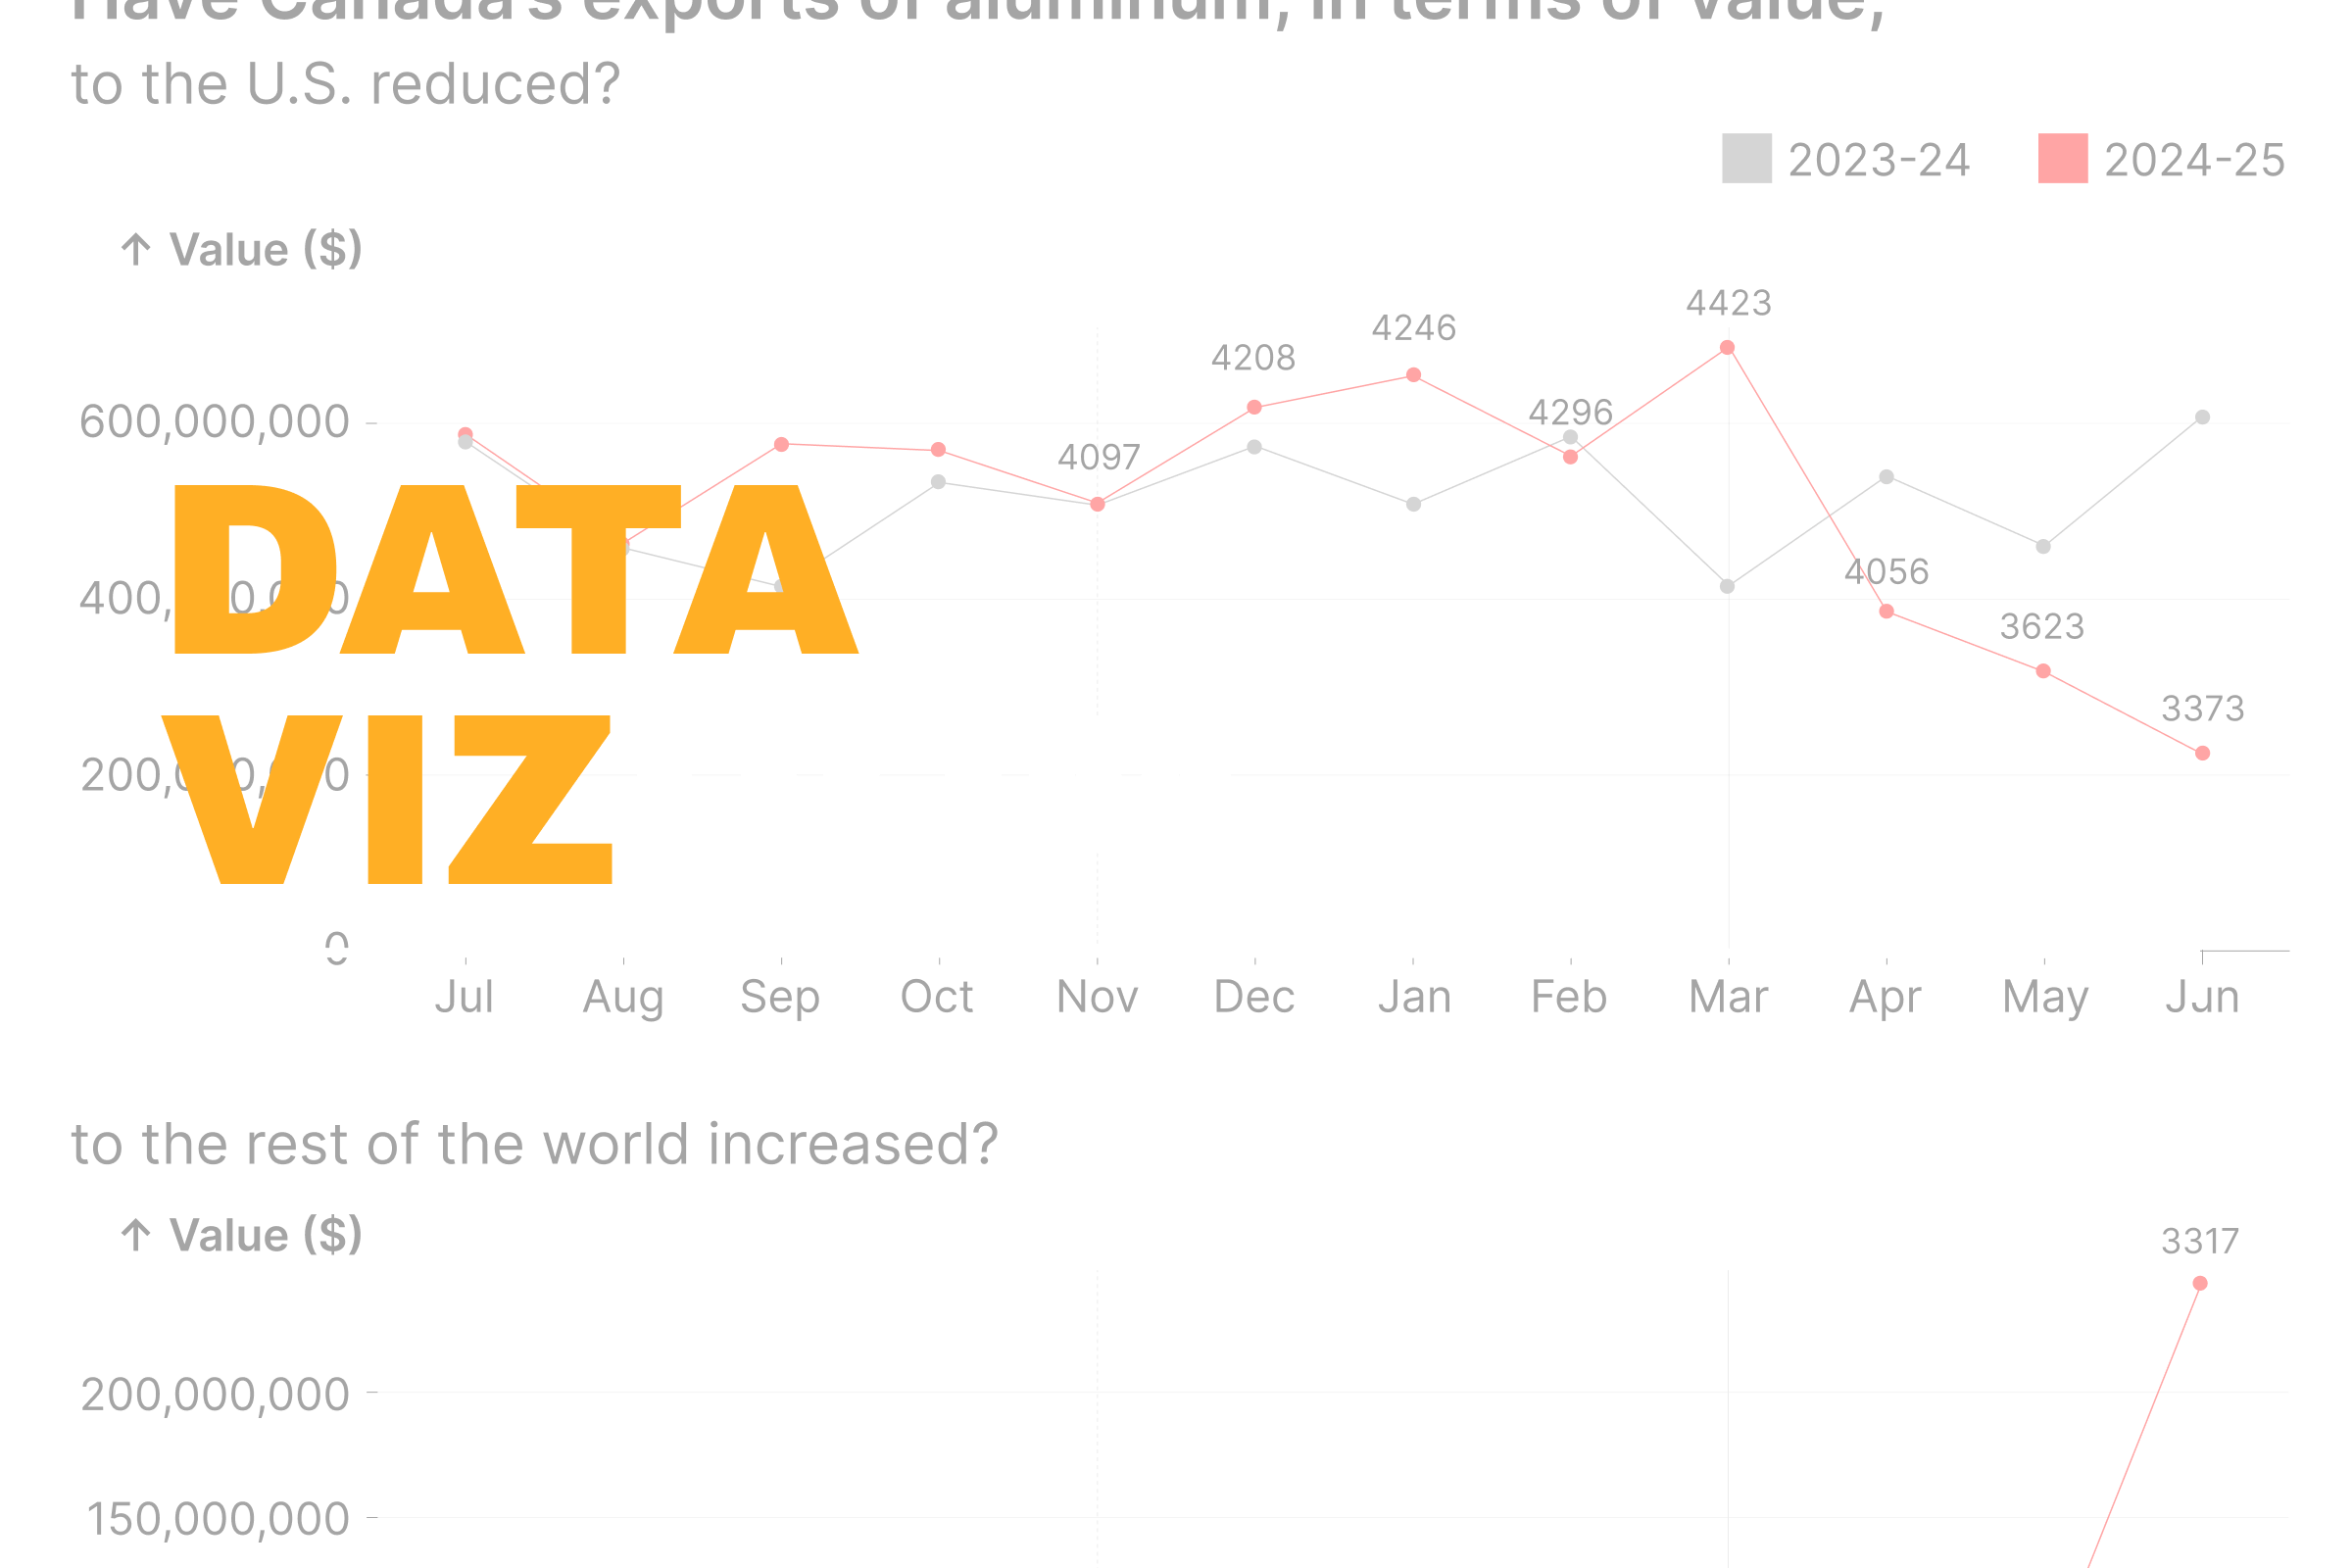
The chart above lists commodities for which monthly exports to the U.S. were at least $80 million between July 2023 and June 2024. The dotted vertical grey line marks the announcement of future tariffs on Canada in November 2024, while the solid grey line marks their imposition, followed quickly by large exemptions. Numbers above the points in the value view show per-unit prices, calculated by dividing the exported value by the quantity.
For unwrought aluminum, first-quarter exports to the U.S. did not exceed volumes from the previous year. In value terms, exports were slightly higher but have since fallen sharply, showing a clear effect of the tariffs. Exports to the rest of the world have been erratic and well below 2023-24 levels, though they have climbed since April 2025. Per-unit prices declined sharply to the U.S. while rising for the rest of the world, possibly reflecting a shift toward higher-quality exports.
Lumber and related products (4407.13, 4407.19, 4410.12, 4703.21) show a relatively flat export pattern to the U.S., slightly below 2023-24 volumes. Exports to the rest of the world are also modestly lower than last year. In value terms, U.S. exports are slightly lower due to a larger drop in prices compared with world markets, suggesting some manufacturers reduced prices to maintain sales. Some products in this category will face higher anti-dumping duties as of late July, which may further influence prices.
Products such as cattle and gold generally seem to follow the front-loading pattern discussed earlier. Most other commodities either follow normal seasonal trends or show increases driven by prices rather than volumes, indicating that the first-quarter rise in overall export values is largely price-driven.
Data Vizdom digs into ideas big and small through visualizations that help make sense of a changing world, drawing on data from the SLGL dataHub.
