With Adam Touré
As industries trade outputs that become inputs for others, an increase of prices in one industry can ripple through the prices of many others. The Vector Autoregression (VAR) model helps track how these price shocks move between industries, including lagged effects that matter in cross-border supply chains where input lead times are longer than in purely domestic production.
This is particularly relevant in the case of Canada and the United States, where free trade and geographic proximity have created deeply integrated supply chains. By applying VAR to the historical prices (2004-2025) of outputs from 21 manufacturing industries in both countries, we can break down price volatility in each industry and identify those that send the largest shocks across the network.
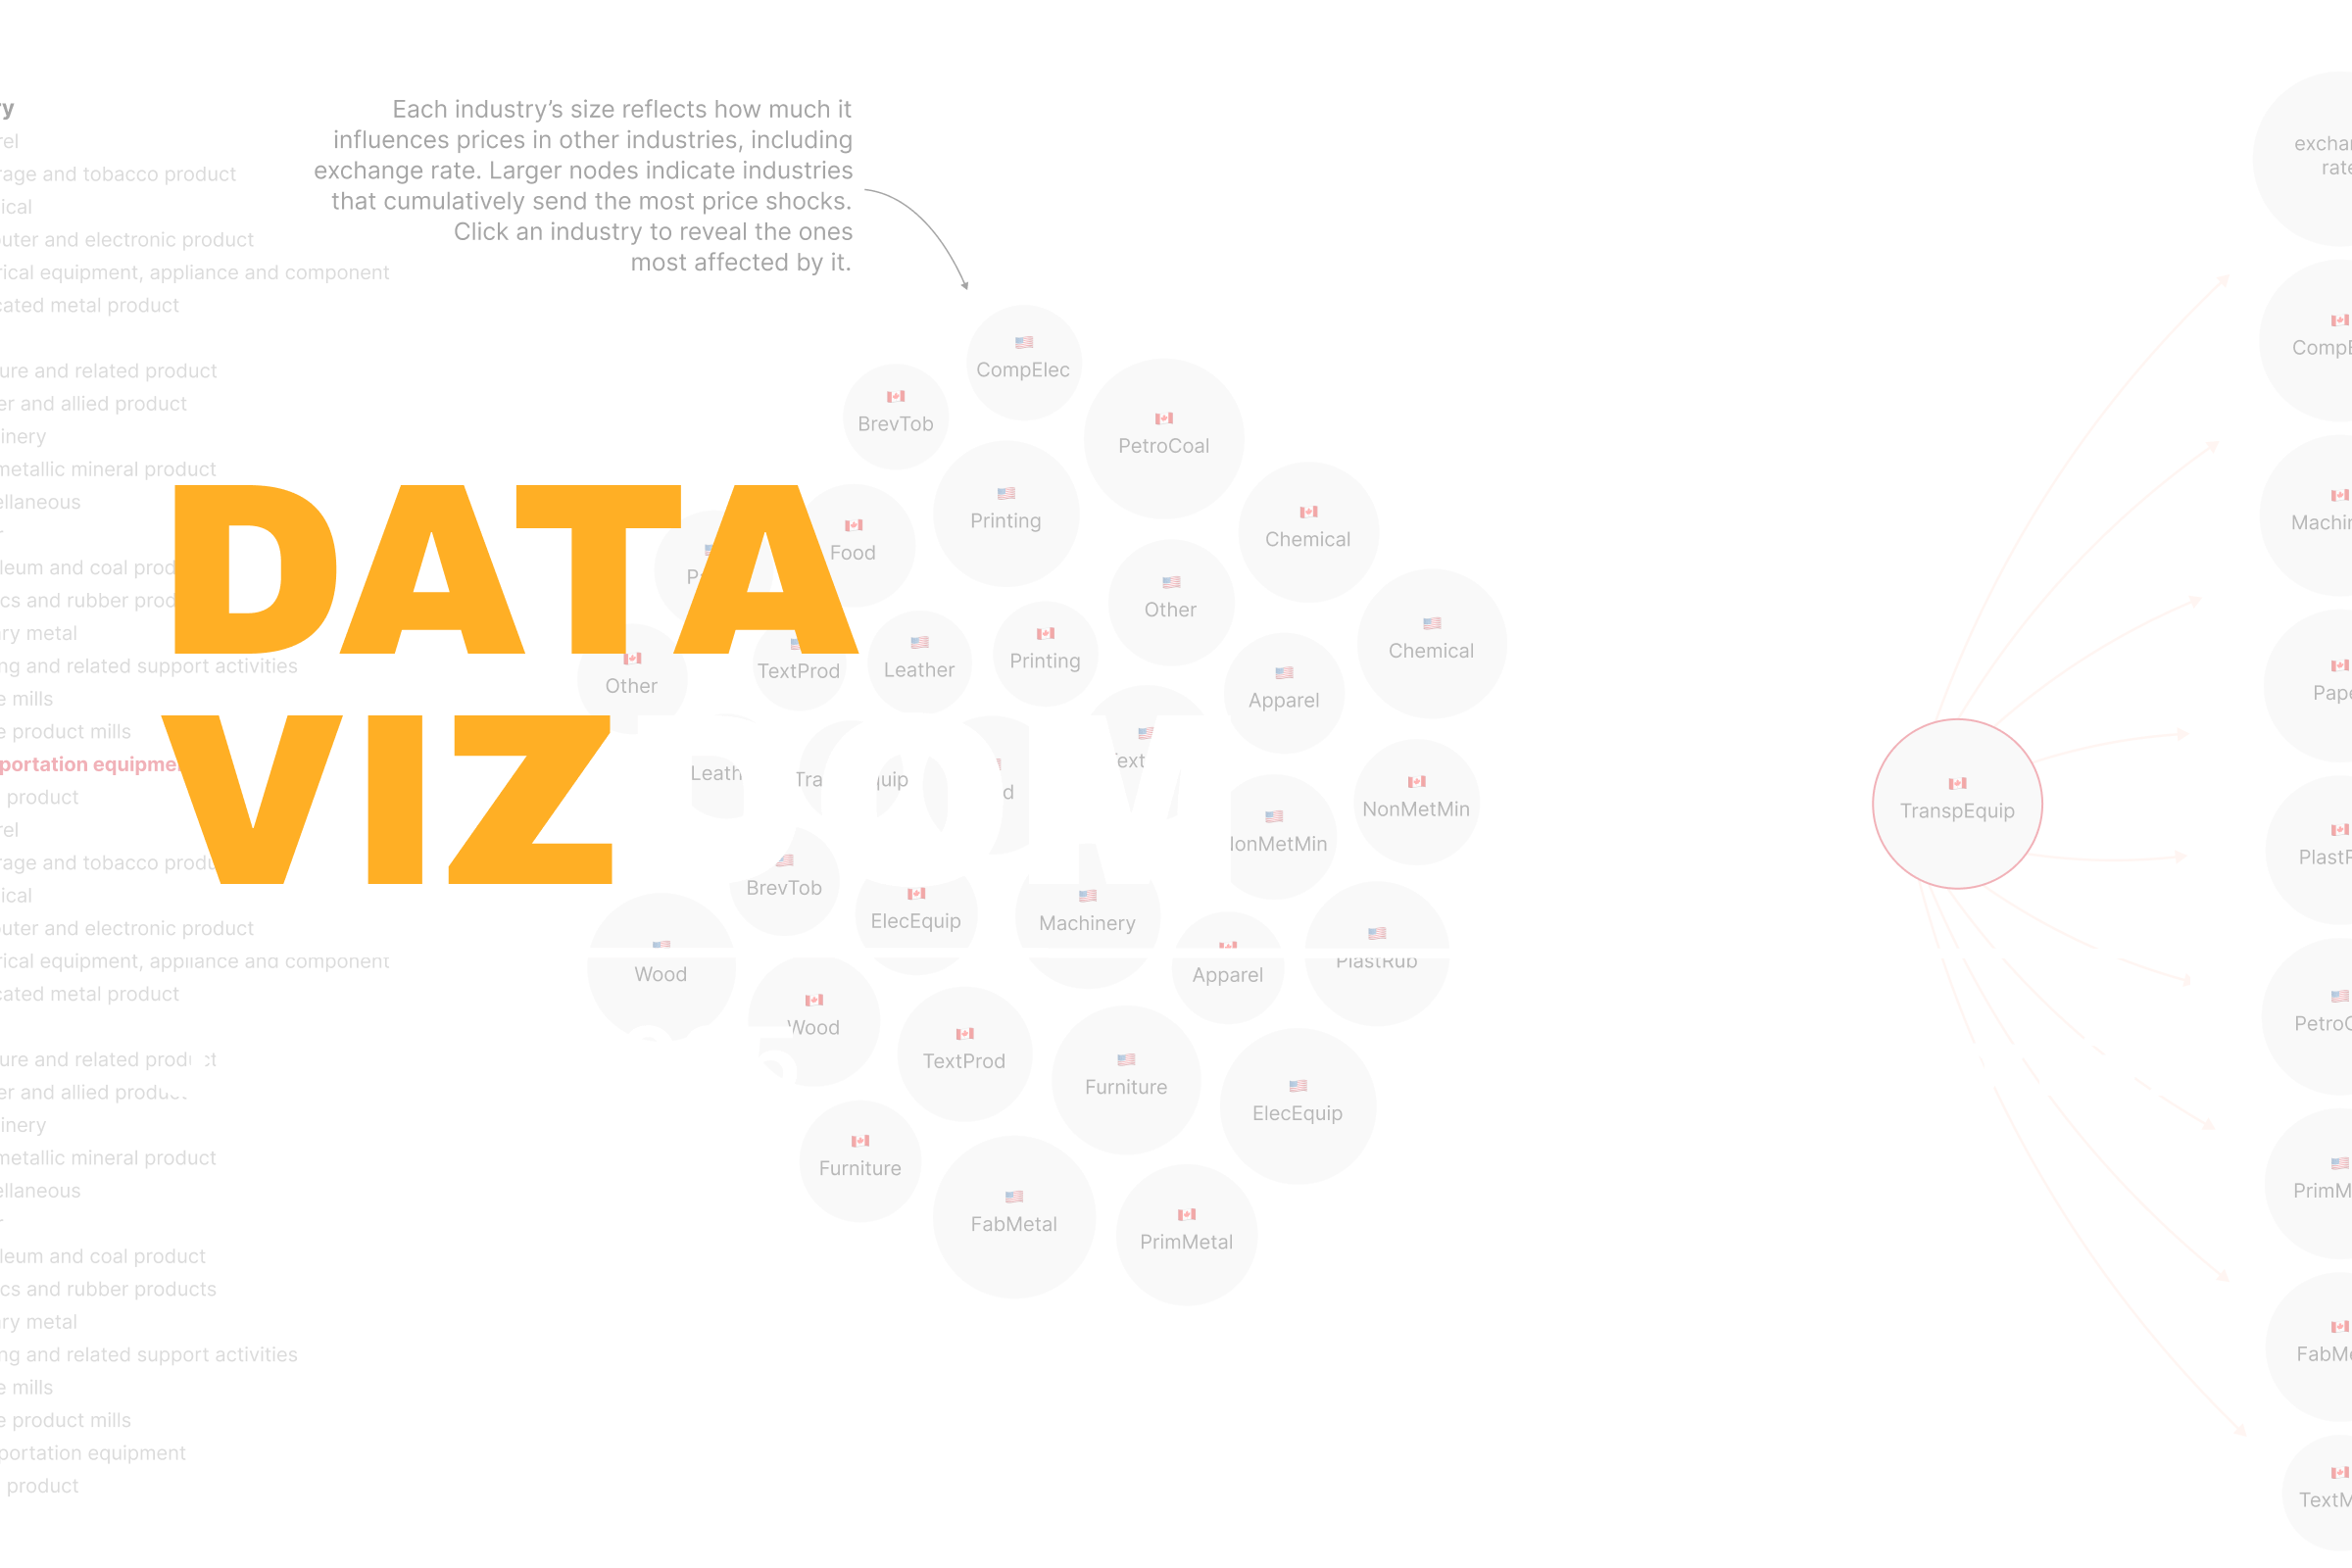
The interactive chart below shows industries as nodes, the largest nodes representing those that send the most price shocks. Clicking on a node reveals the industries most affected by it, along with the size of the shock.
Outside of price shocks coming from the cross-border exchange rate, Canadian transport equipment manufacturing sends the most shocks across the network. It is followed by U.S. fabricated metal product manufacturing and Canadian computer and electronic product manufacturing. This makes intuitive sense since the outputs of these industries are widely used across many other sectors.
Clicking on Canadian transport equipment manufacturing shows that it sends its largest shock to the exchange rate. It also sends strong shocks to Canadian computer and electronic product manufacturing (14 points) and to Canadian machinery manufacturing (12 points). U.S. petroleum and coal products and U.S. primary metal manufacturing also appear among the top receivers, which highlights the cross-border significance of this Canadian industry.
At the other end of the scale, U.S. textile product mills and U.S. transport equipment manufacturing send the smallest shocks. Clicking on these industries shows that their largest effects are still felt in Canadian industries, but the size of these shocks is much lower. This may be due to weaker upstream roles in supply chains, lower levels of domestic sourcing, or less integration in North American production networks.
To conclude, knowing which industries trigger the largest price shocks helps businesses and policymakers better anticipate disruptions. It supports smarter decisions on inventory stocking, sourcing, and price-setting, while giving policymakers insight into where volatility may concentrate, helping them target stabilization efforts or strategic interventions in key sectors.
The indicators in this article are currently being developed at our lab, building on ongoing research by Adam Touré, Martin Trépanier, and Thierry Warin.
What better way to understand concepts big and small than through data visualizations? In this blog series, we explore timely themes in economics and transportation, drawing on data from the SLGL dataHub.